EDIFYING THE ART OF EDUCATION
From January 2022 to March 2022 I was part of a team contracted to help reimagine what it might mean to create and deliver a college course so that learning happens for both the instructor and students.
EXPOSITION
THE CLIENT

Founded 2021, Argos Education, an EdTech startup, seeks to build a platform that allows educators to create custom textbooks and courses that can be bought and sold in a marketplace.
THE PROBLEM SPACE
Textbooks are expensive, and students and faculty may only use a small portion of them.
Textbooks can’t be customized to fit course topics.
Postsecondary faculty receive no training in how to instruct.
Postsecondary faculty are forced to use products that require more tech savviness.
Instructional designers[1] struggle with getting postsecondary faculty to use learning science[2].
Instructional designers have little time and limited tools to ensure courses use learning science best practices.
[1] a role that designs the learning experiences in accordance with learning science
[2] validated best practices in how to craft and deliver learning experiences to maximize learning outcomes
REIMAGINE THE COURSE CREATION PROCESS FOR TEXTBOOK 2.0 IN 10 WEEKS
THE CHALLANGE
From the client:
“Create an intuitive and effective way for creators to set up course goals, outline the course, prototype units, add content, fine-tune the design and test it with early adopters”
MY ROLE
I contributed to every part of the UX process for one cycle: product definition to validation.
I was most heavily involved in: facilitating client meetings and identifying business goals, designing research plans, facilitating user interviews and usability testing sessions and running accompanying debrief workshops, research participant outreach and followup, research analysis, wireframing and prototyping, writing the research report, and completing the final presentation.
I worked alongside 3 other UX consultants.
THE KICKOFF
STARTING MATERIALS FROM THE CLIENT
We were provided with their existing personas, a white paper defining the current state of courseware (products designed to enable the creation of "courses" for learning), and a video of a clickable demo showing an early iteration of their product Sojourner.

From the personas, the team learned that Argos centered course creators around “Deborah Designer” who is an instructional designer.
We discussed the appropriate platform and jointly agreed that web, on a desktop made the most sense given how courses are currently created.
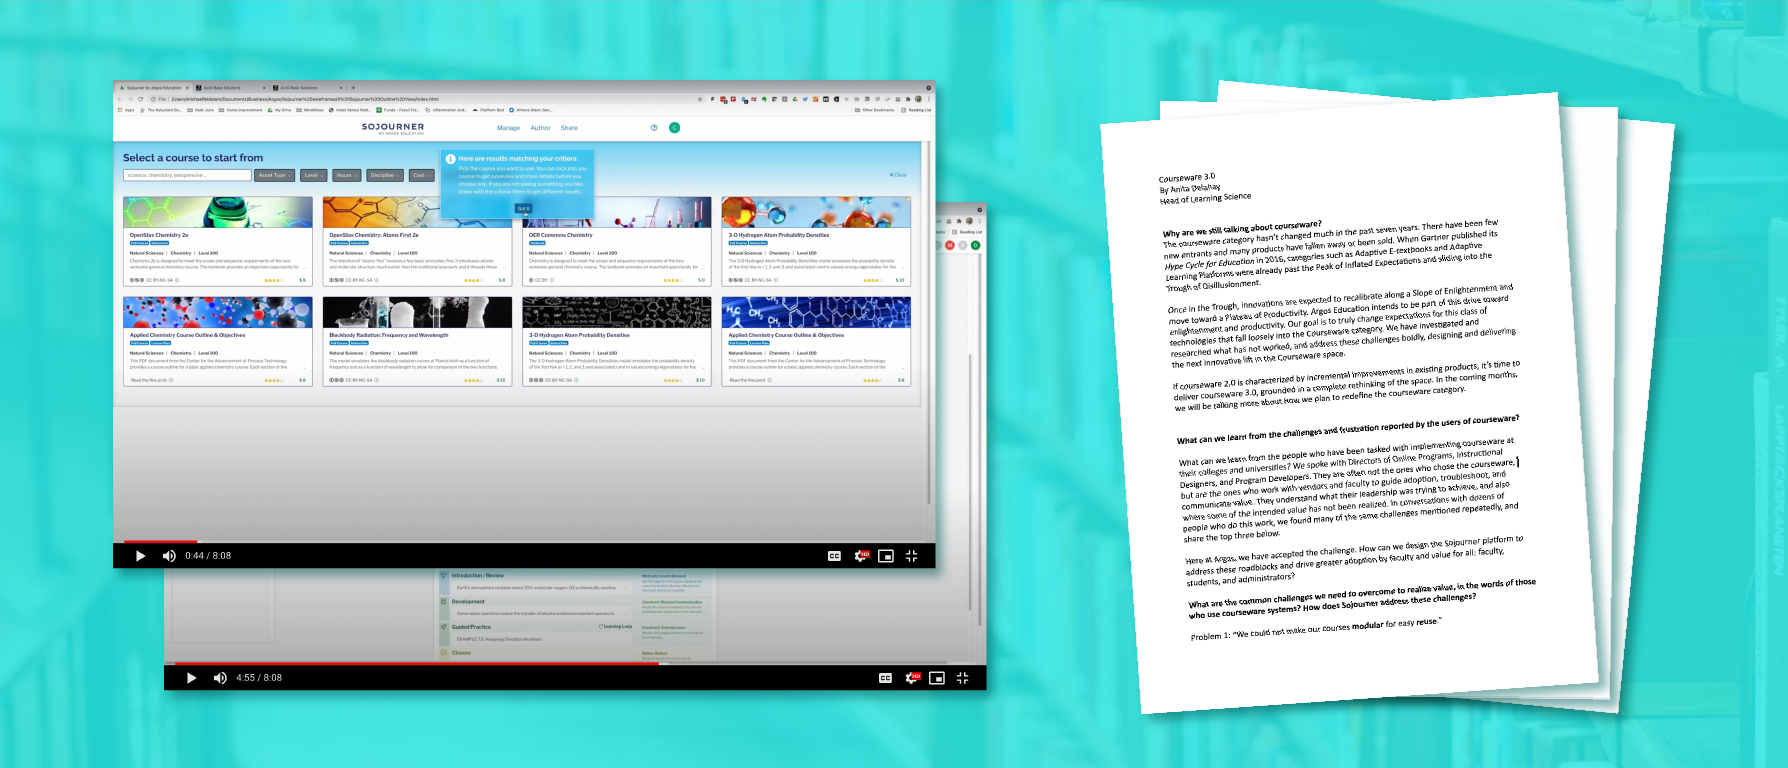
The white paper and demo helped outline the initial vision of Sojourner as a time-saving platform with machine-learning suggestion capabilities.
Client Assumptions:
Instructional designers use quantitative data to improve course design. Faculty could also be doing this.
Platforms can give nudges and active recommendations to change course creation behavior.
Client Product Goals:
“We want [our product] to make teachers better.”
“….provide scaffolding for educators.”
“…learning from the ‘book’ & class to be more connected.”
We weren't granted access to the demo as Argos wanted us to completely rethink the experience from the ground up.
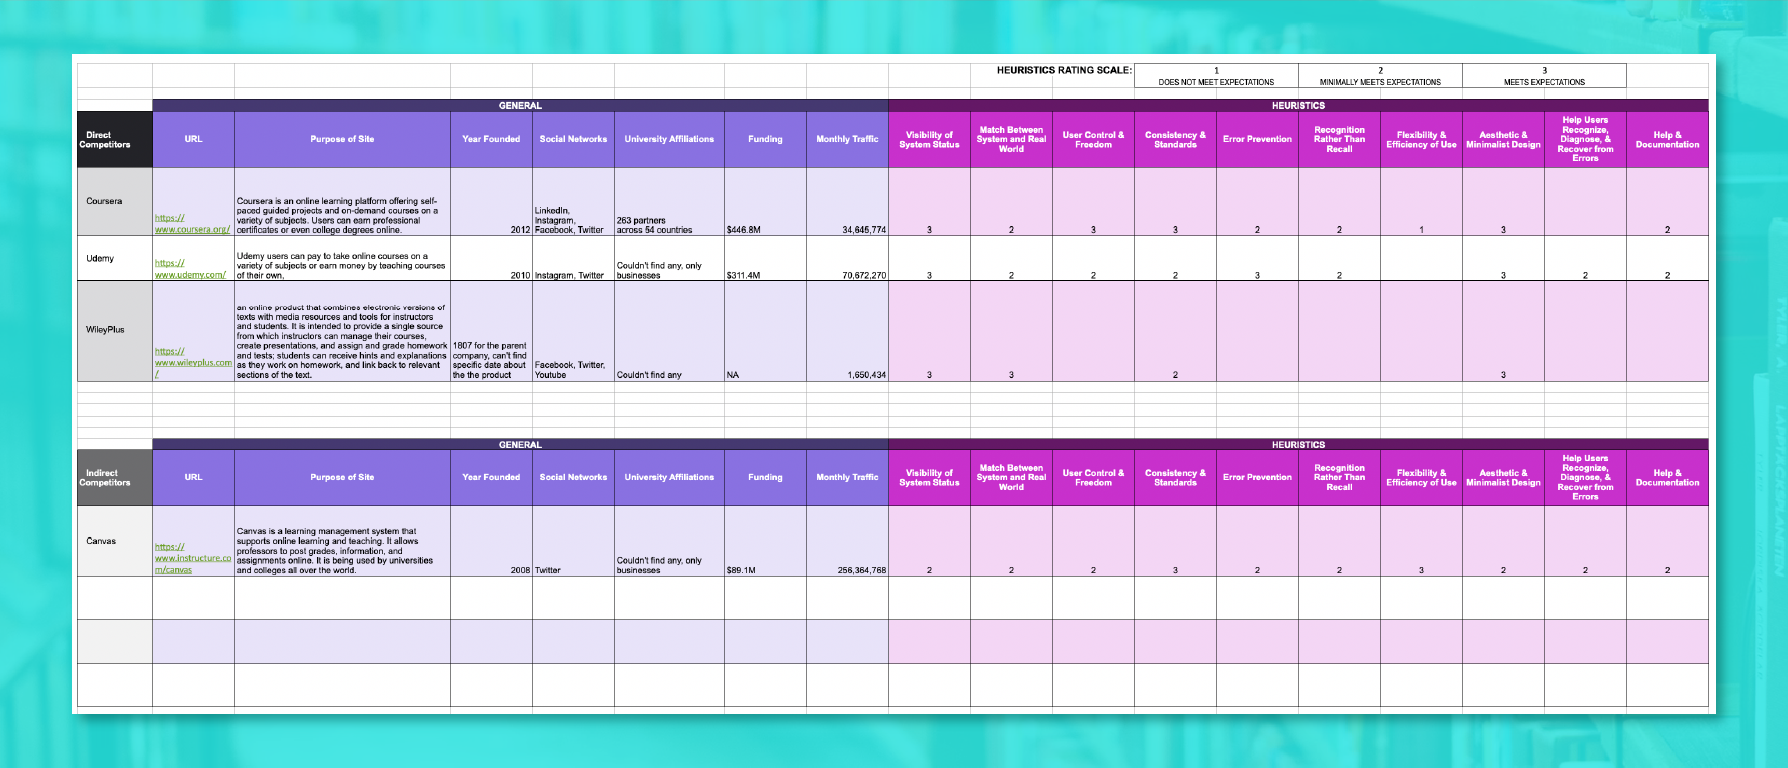
COMPETITIVE ANALYSIS

Competitive analysis completed by Anne Costello and myself. Blank entries are due to direct access to products being unavailable.
We performed a competitive analysis and heuristic analysis with the goals of:
Define the minimum feature set needed to compete in the courseware space
Gain an understanding of the general usability involved in current course creation flows
Map the existing landscape to understand where Argos competes
Challenges:
All the competitor products required university affiliation for access. Requests for demonstrations went unanswered.
Solution:
Data was gleaned from available webinars, demos, and instructional videos from Youtube.
Findings
Ability to Express Course Vision & Customize Work Environment:
Limited customization features: from none, to simple hide/show options, media selection, and order of content.
Very few tools to build “bespoke” content.
Design environment itself is very rigid
Argos’ Vision vs. Features in Market:
No one is making the learning science easily accessible
No one is placing community resource front and center
No one appears to be allowing users to charge for their content
Most sites use jargon (web design or made up)
Common Elements of Postsecondary Courses:
Material organized into modules/units with formative and summative assessments
Some offer study guides/hints for students
Videos, interactive content
Industry Norms/Trends for Content & Design:
Videos, sometimes w/ script that highlights current position
Menu and “course” nav on left, editing menus in top of right
Help & suggestions are mostly popups. pop ups usually divert out of the design environment to a FAQs or community forum
EMPATHY INTERVIEWS
Because we didn't have access to Sojourner, we couldn't perform evaluative research against the current experience so the team proceeded with empathy interviews.
Interviews were conducted and facilitated by Anne Costello and myself and lasted 60min over Zoom.
The team interviewed 9 participants representing a mix faculty/instructional designers.
The competitive analysis helped inform the interview script regarding asking about specific features and how tasks are accomplished.
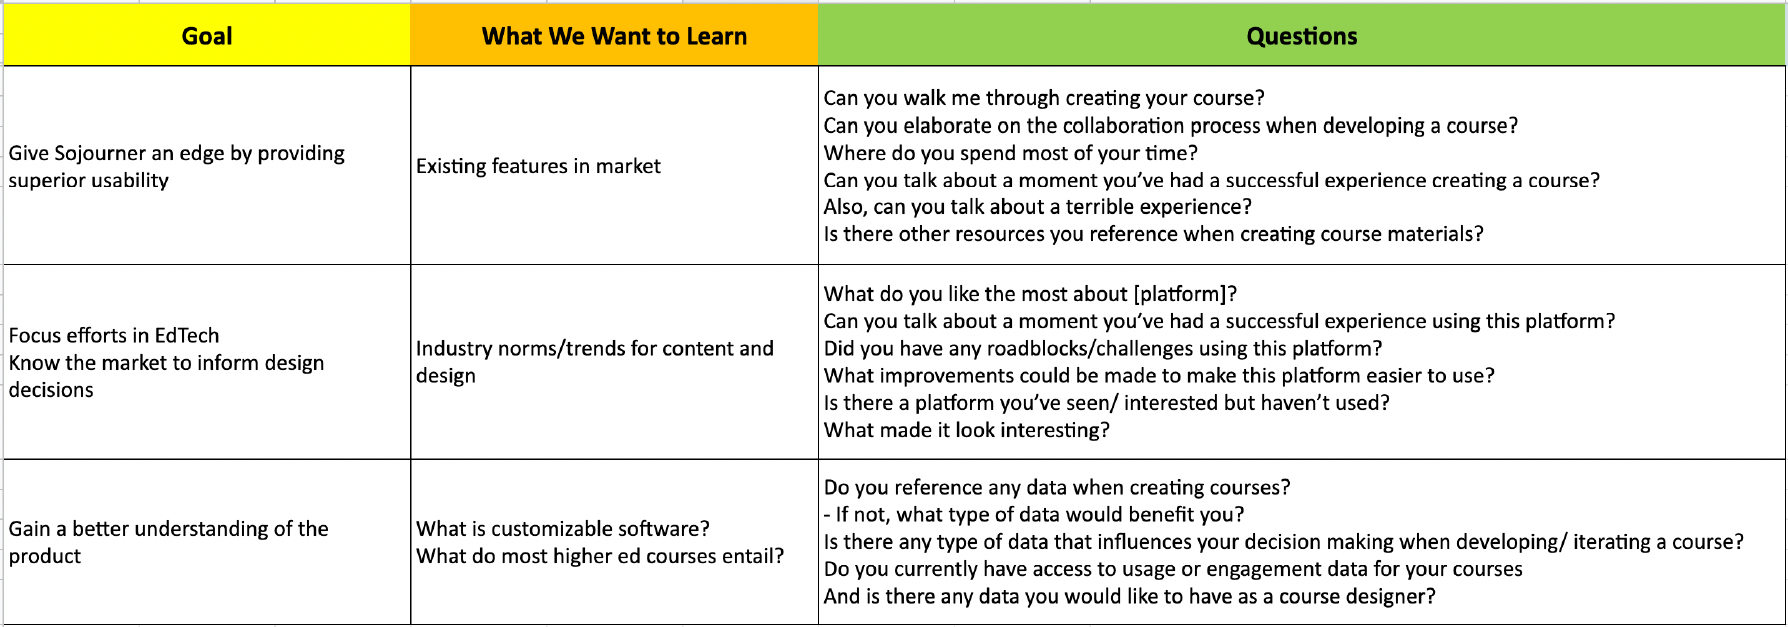
We generated our questions by starting with our goals and what we wanted to learn to help make them happen.
Each interview was followed by a debriefing session.
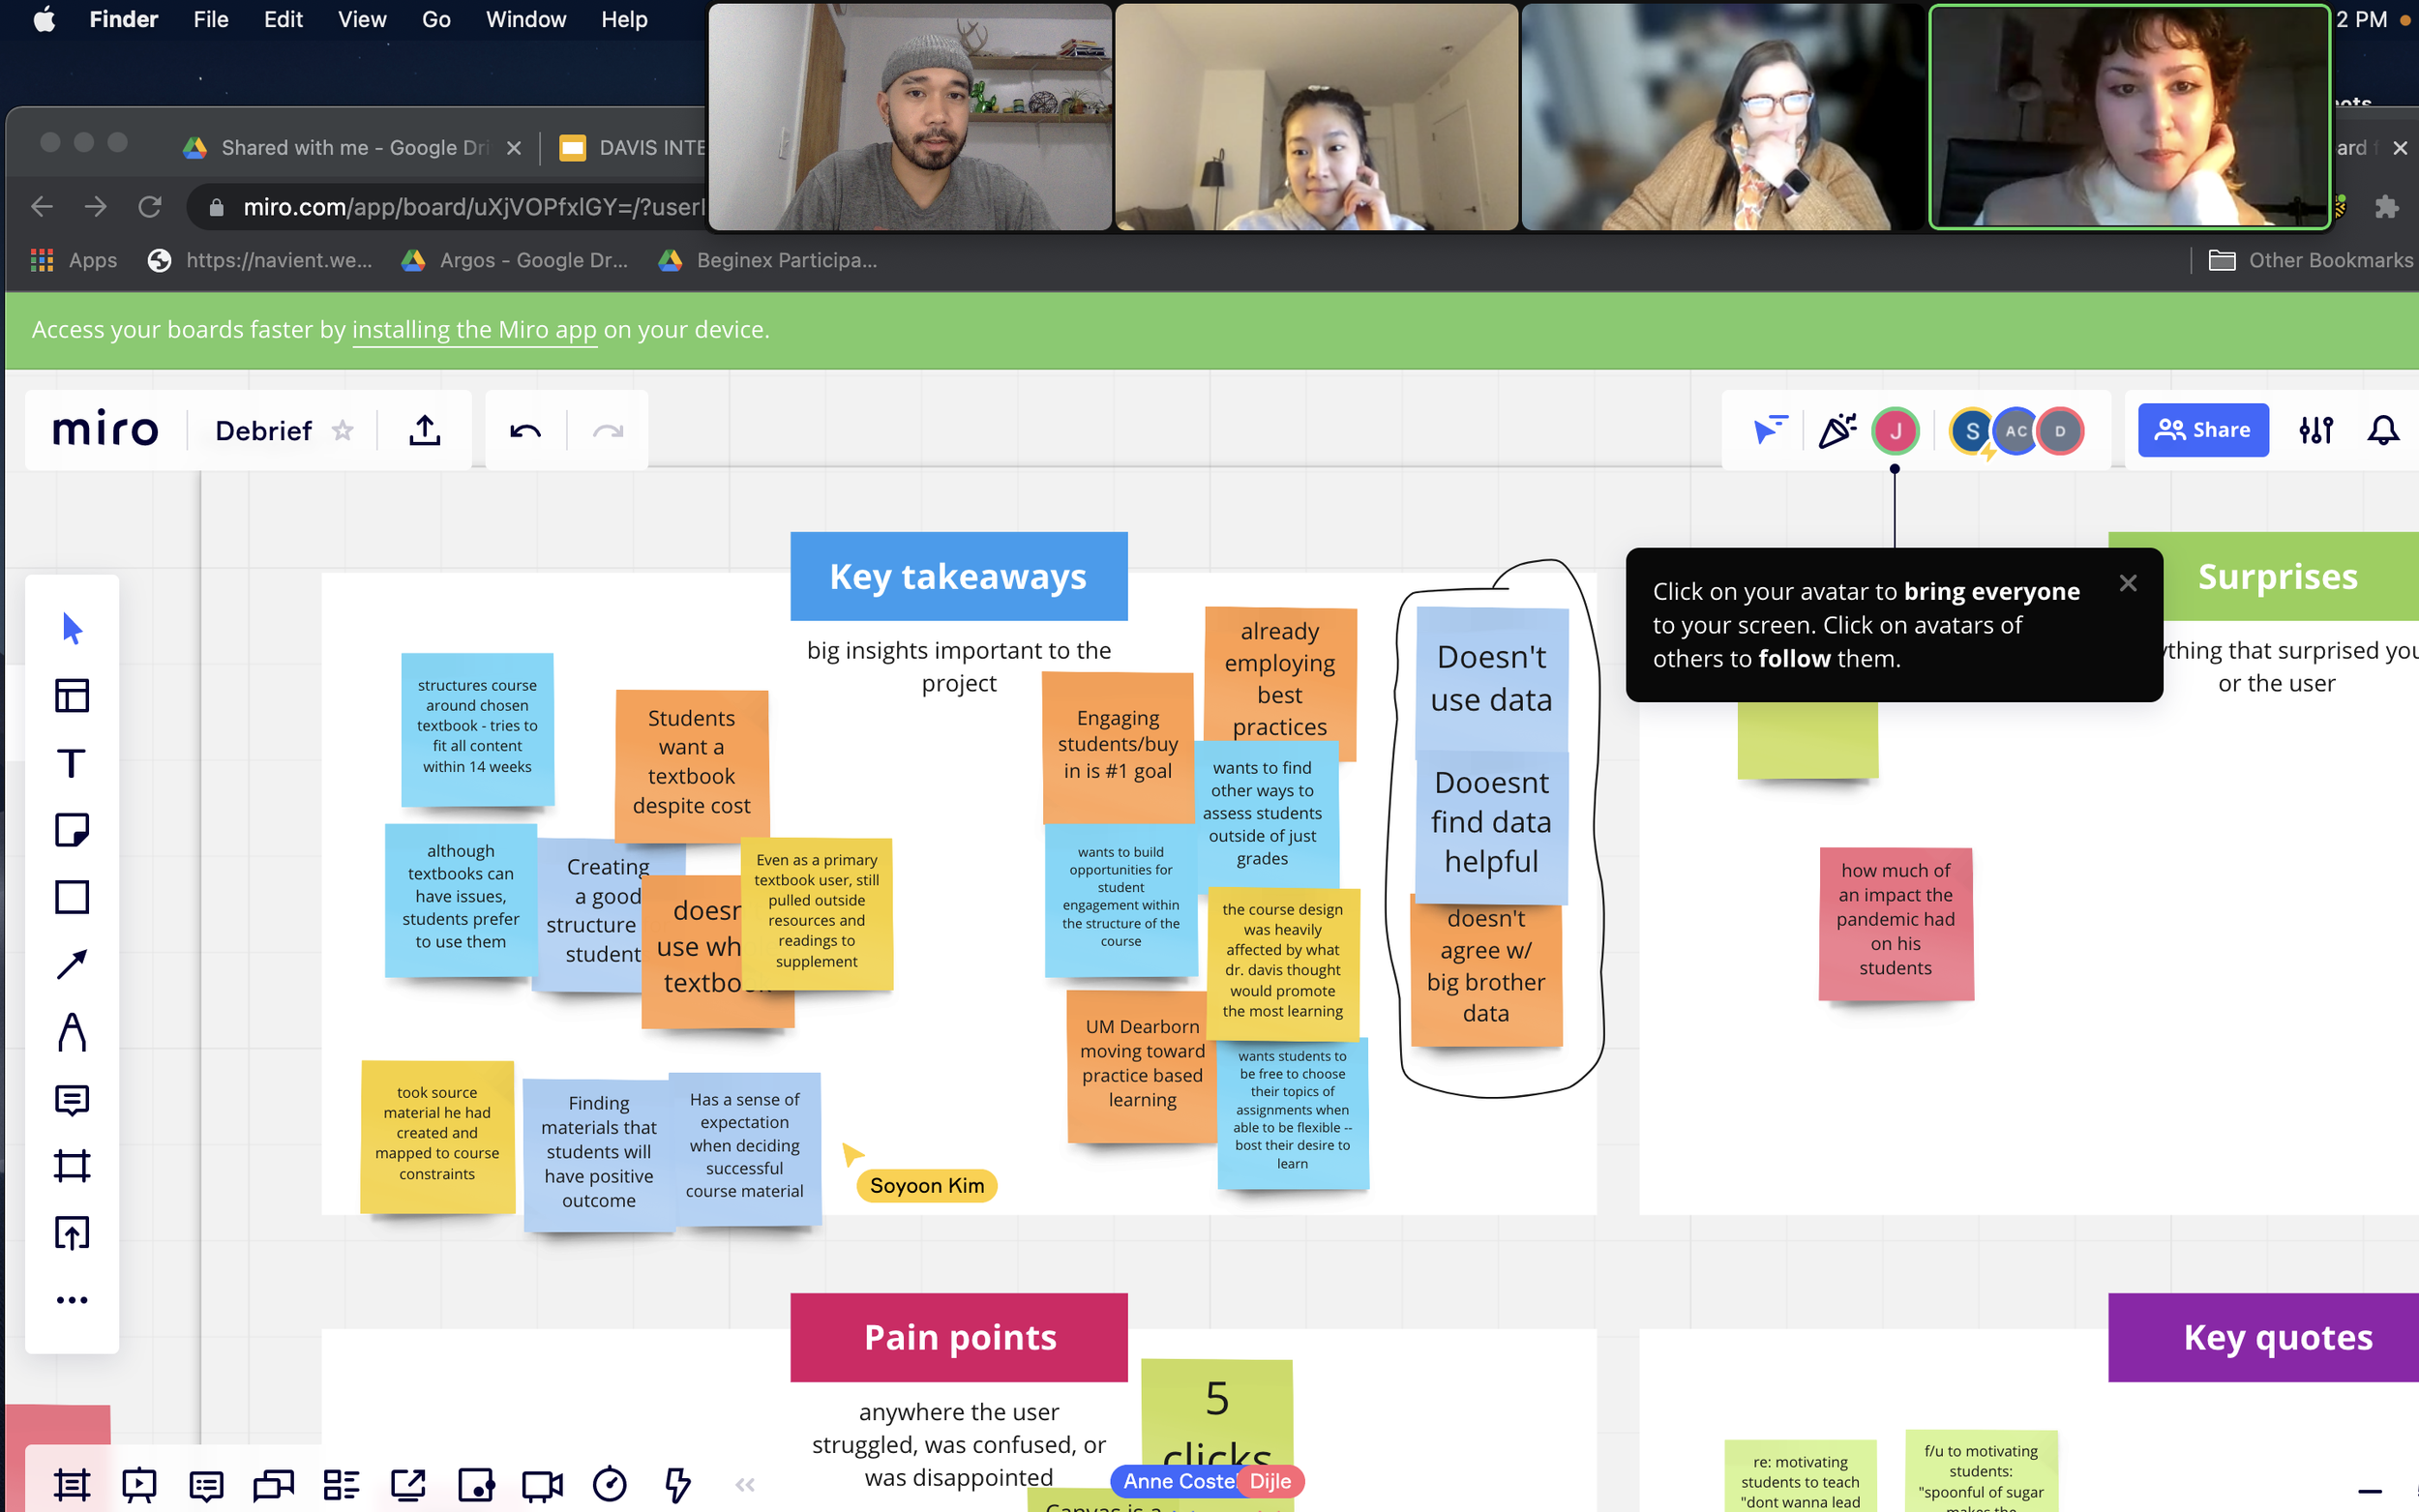
Observations were mapped into:
Key Takeaways
Surprises
Pain Points
Key Quotes
The team then performed affinity diagraming in each category which made the meta-analysis of all the interview observations fast and easy.
THE DISCOVERY
COURSE CREATORS DON’T USE QUANTITATIVE DATA TO TRACK COURSE SUCCESS WITH STUDENTS
Regardless which persona type each participant fit into and their level of tech savviness, qualitative data was used to assess how well the course was being received by students.
Our client was stunned as this challenged one of their assumptions.
“I use the pain of the previous class to inform the design of the next.”
Faculty Member: Professor of Linguistics / Male / Early 60s“…unfortunately we don’t prototype or test classes. We view their first semester as a type of pilot. We use qualitative surveys to gauge the student experience.”
Instructional Designer: Lead Instructional Designer and eLearning Developer / Female / 48“I would rather just work on developing relationships… and use my ability and intuition as an instructor.”
Faculty/Instructional Designer: Associate Director, Learning Experience Design / Female / 46
The finding informed us that course design was more heavily influenced by an iterative, feedback loop with learner cohorts.
DIGGING DEEPER
ROOT CAUSE ANALYSIS
We took our initial findings and applied the 5 Whys method to try and distill root causes.
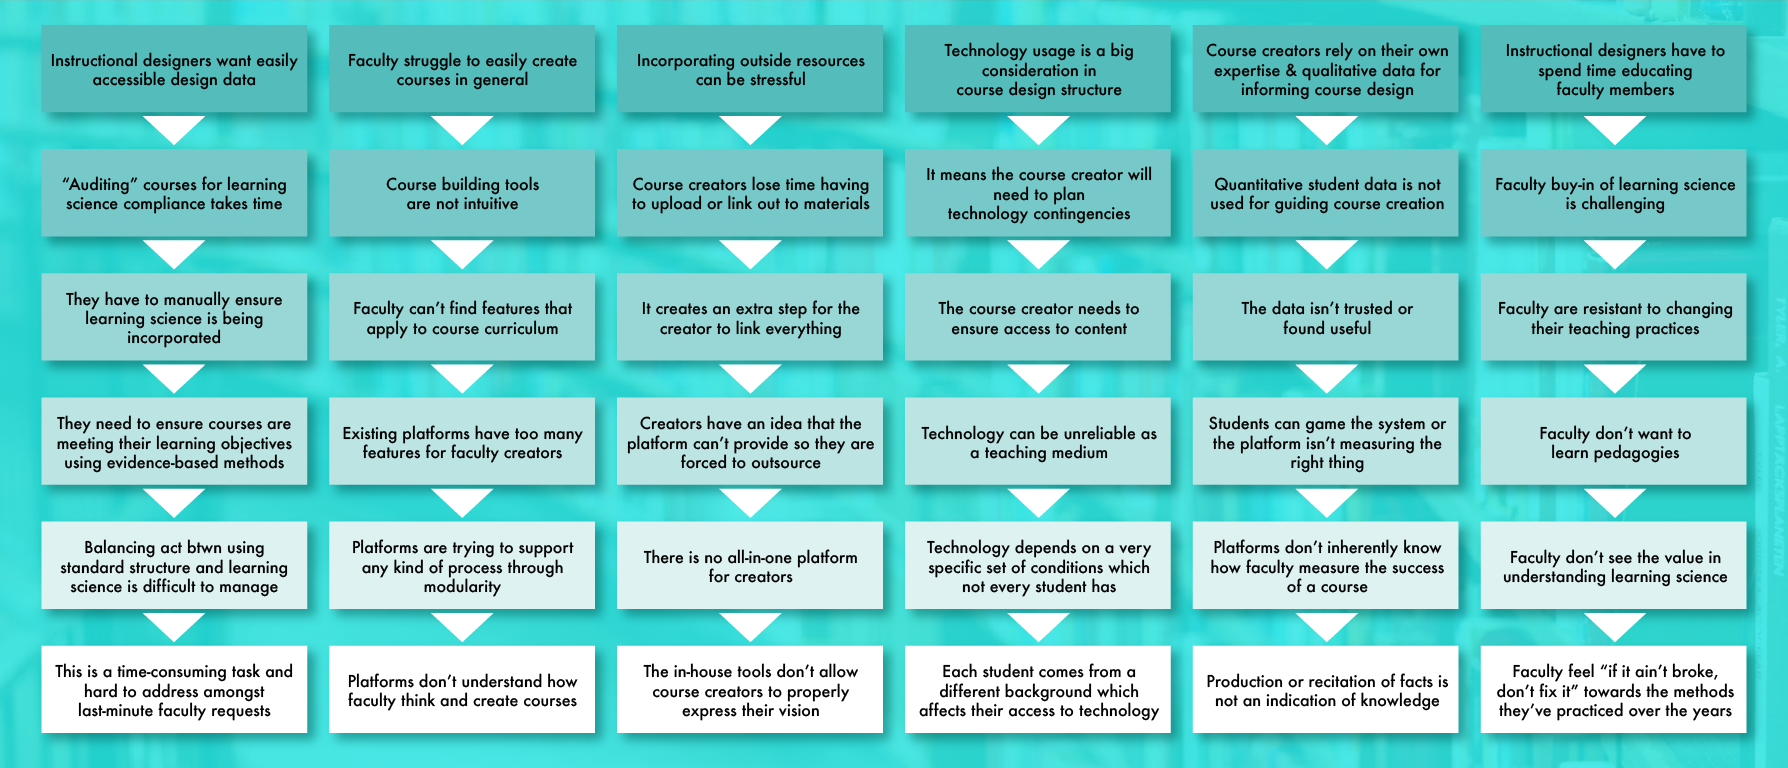
Key Insights
Platforms don't understand how faculty think and create courses.
Students come from varying backgrounds / socioeconomic statuses which dictates what devices they have to access course materials
Production or recitation of knowledge is not a true indication of learning.
In-house tools don't allow course creators to properly express their vision
Faculty feel “if it ain’t broke, don’t fix it” towards the methods they’ve practiced over the years
Instructional designers don't have a quick and easy way to ensure course structure aligns with pedagogy while working under tight deadlines
A QUESTION OF TIME, EFFORT, & SCOPE
DESIGNING OUR SCOPE FOR IMPACT & TIME
We took our root causes and transformed each of them into opportunities.
However… given the limited amount of time we had, we scored our opportunities to see where we might best focus our talents.
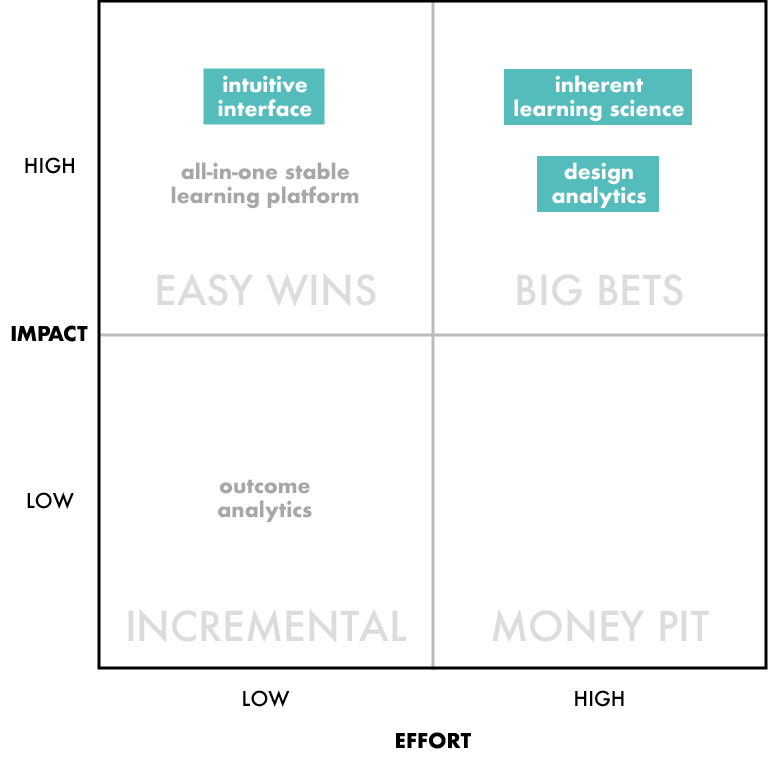
The team decided to focus on the three highlighted design opportunities.

Informing the client team about our intended scope for addressing the challenge
We felt they most closely tied to Argos’ value proposition and the product goals we elicited from our client meetings.
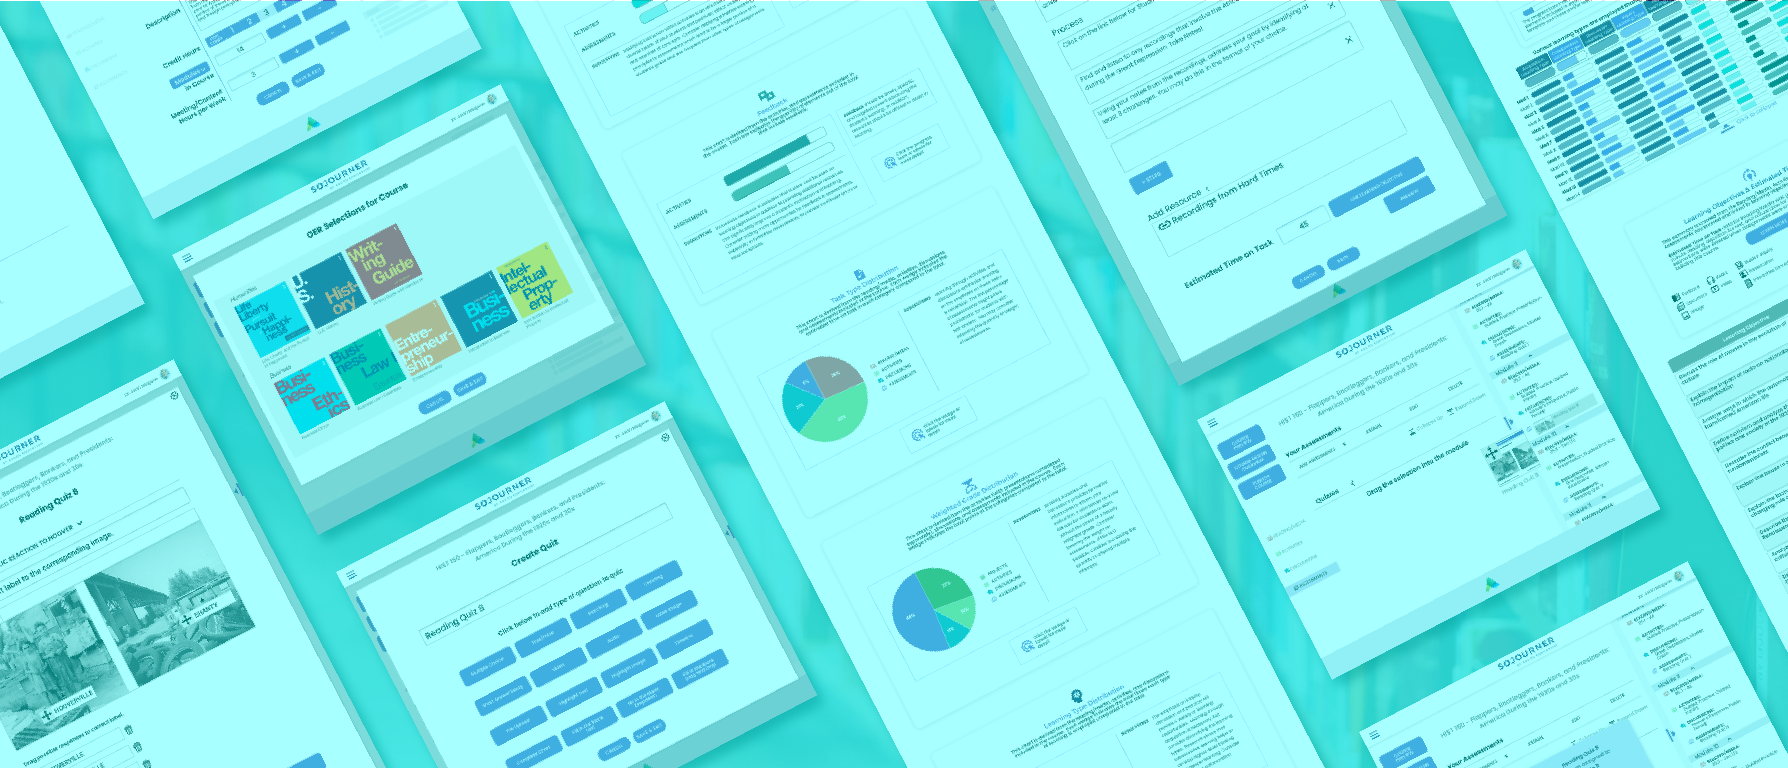
COURSE CREATION REIMAGINED
INTERFACE AS EDIFIER
“Help instructors be their best selves through learning science data”
We kept this in mind when moving forward with the reimagining of Sojourner. Learning science is baked into the product meaning that the very act of creation is a realization of user interface enabling us to do better than we might’ve imagined.
Design system of the prototype led by Soyoon Kim.
Course Creation: One screen sets you up for success
Just one setup screen sets up the course.
Access this part of the prototype here.
Course Structure: A million moving parts all in one place
A populate-as-you-go outline of the course allows course creators to see what's been planned at any given time in the course. Using data from the course creation screen, the overall structure of the course is built out for immediate slotting of content.
Access this part of the prototype here.
Demonstration of a course structure scrolling, maximizing, and minimizing
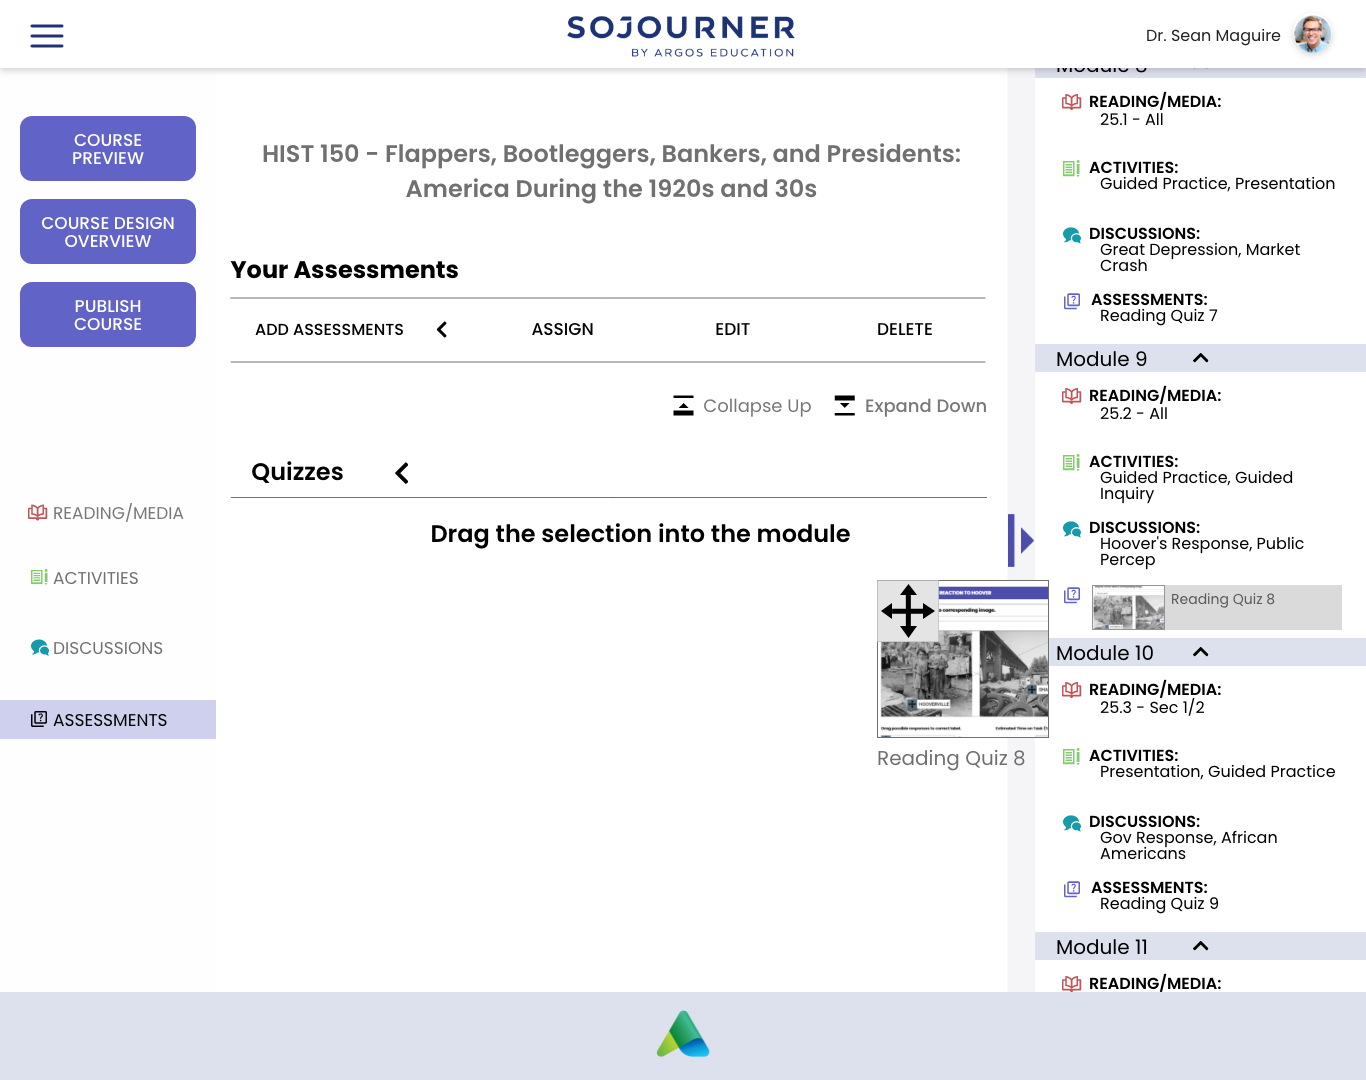
Drag & Drop Content: Set it and forget it
Almost all content can be planned and assigned using a drag and drop interface at many levels in the interface. The UI gives feedback about where your content will land and a confirmation message that assignment was successful so that less tech savvy users understand what they're doing and have accomplished.
Access this part of the prototype here.
Demonstration of a quiz being slotted into the course structure
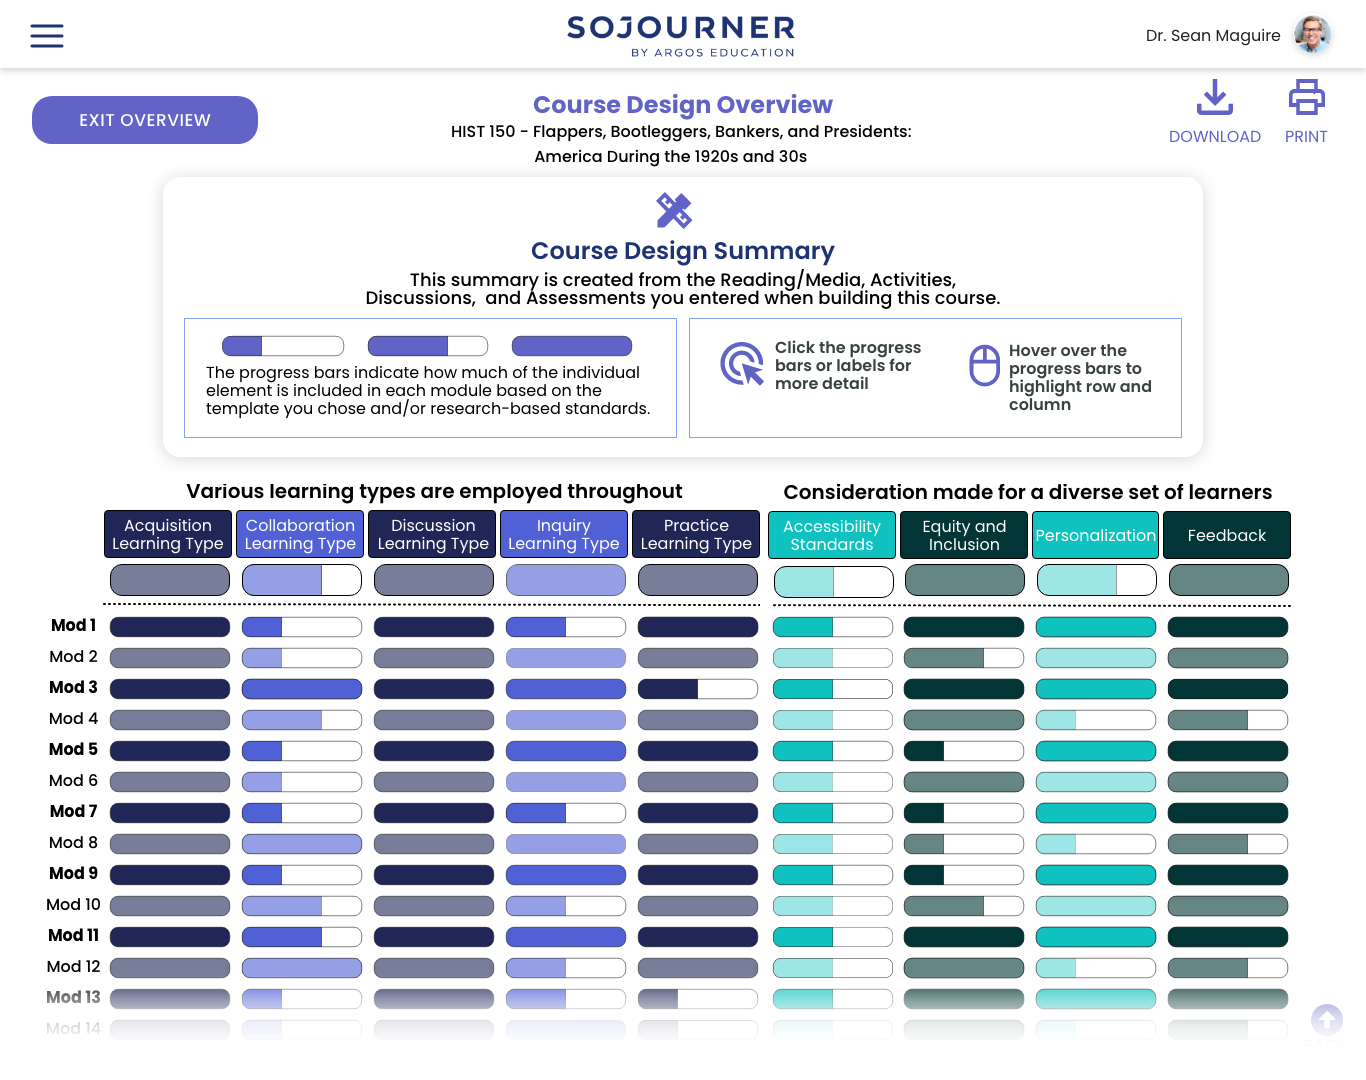
Design Analytics: Insight on how to Level Up Your Course
Course creators can leverage the power of Sojourner to analyze and give insights into what the student experience might be like through summary dashboards that give a high-level view of how the course content aligns with learning science considerations.
Summaries can be expanded to provide a module-by-module for those wanting more granular information.
Access this part of the prototype here.
The design analytics work was spearheaded by Anne Costello.
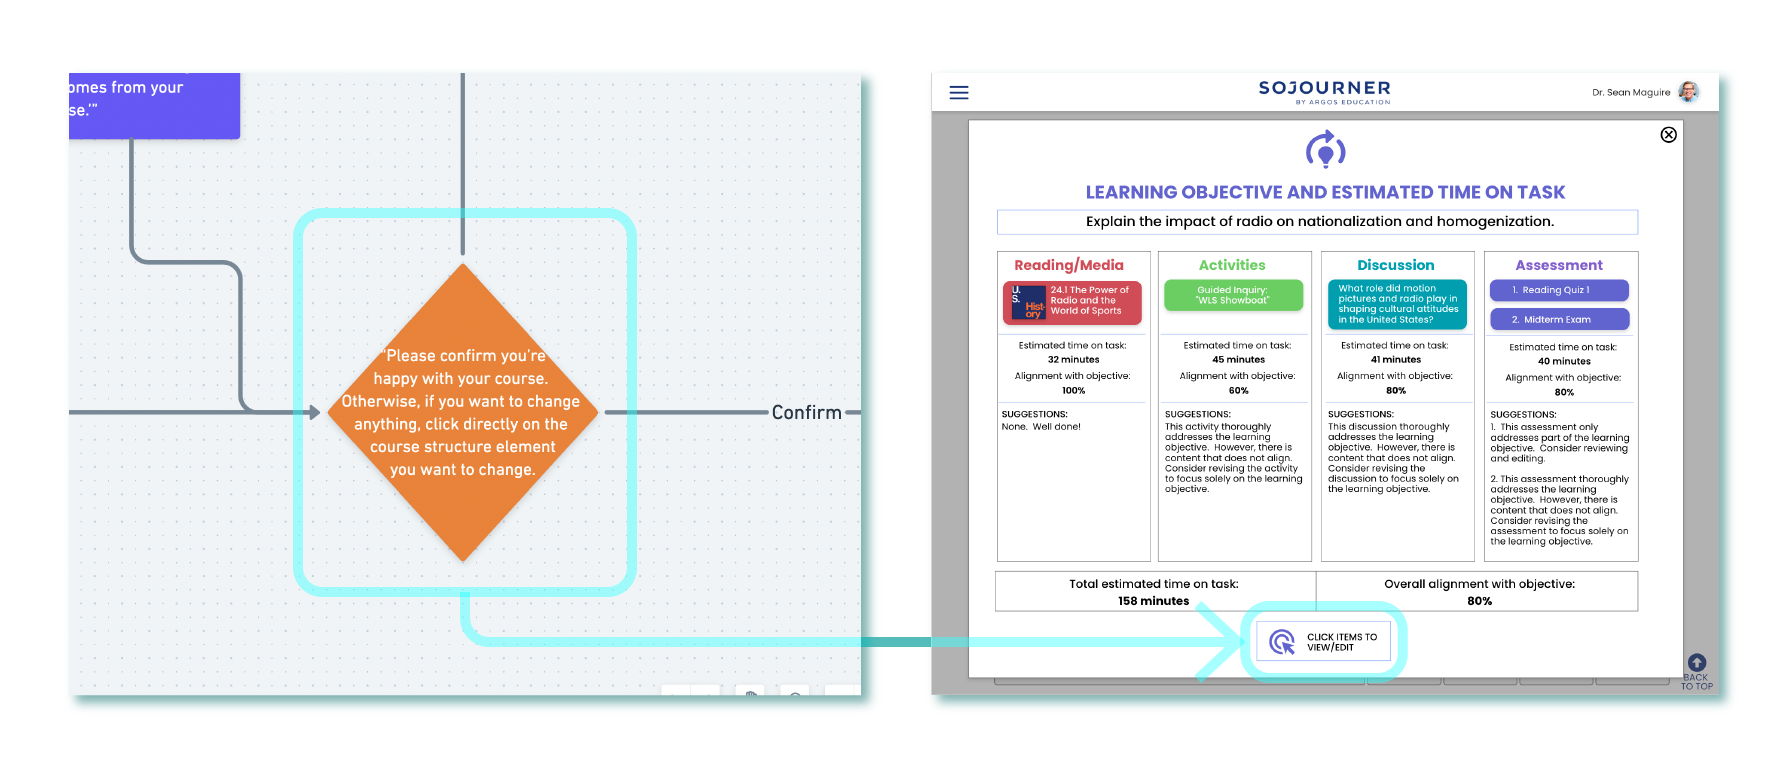
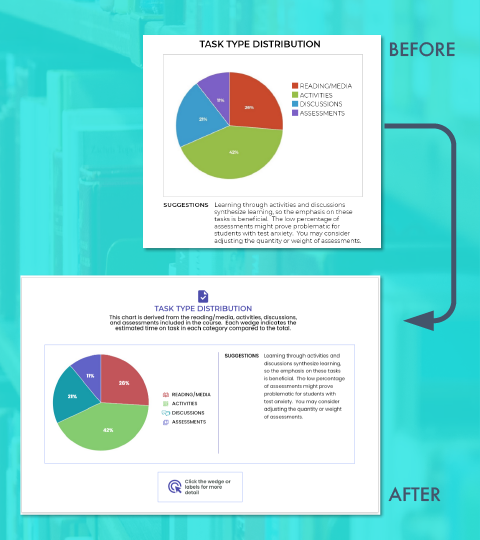
Course creators can also receive insights concerning how the course composition breaks down regarding task type, grade weighting, and learning type as well as how course content measures against standards of accessibility, equity & inclusion, personalization, and feedback. All of those listed areas are important to learning science practices and helping course creators realize if the course matches their vision.
All of the activities are shown in relation to their learning objectives which can help instructors understand how the course composition supports learning goals.
Much like the general course structure, the learning objectives table gives a summary of the structure of learning goals and how they are supported. Hover state pop-ups help keep the table readable while giving more specific information.
Each objective can be clicked on to give more information while also enabling the course creator to directly access the related content if they want to make changes.
The entire happy path final prototype can be accessed here.
HOW WE GOT HERE
PRODUCT AS PROFESSIONAL DEVELOPMENT?
The team formed the design strategy around these 3 key questions:
How can we make features beneficial to both faculty and instructional designers?
How do we empower course creators to incorporate learning science in a dignified manner?
How do we support the natural iterative process of course creation in a way that's easy and intuitive manner?
In laying the foundational work for the design, it was important for us to keep the two main creator types in mind.

The two course creator personas the team constructed helped evaluate how each role might feel about design choices being made.
MODULARITY AND COMPONENTS FOR ALL
During our user interviews, we noticed instructional designers kept stating the need to “check for alignment” between learning objectives and planned activities, while faculty members needed easier ways to construct courses in general (they had lots of pain points regarding leveraging the UI in existing products). Faculty members mentioned lots of clicking was required to get anything done, especially in having to setup the course structure through folders.
The team’s initial usability testing agenda included a drag and drop test to see if the majority of users would understand using that pattern to assign content. 7/9 users did it easily.
Participants commented that the crosshairs informed them that they could drag the bars. In later versions, we increased the contrast between the crosshairs and background to highlight this affordance/improve task success.
We felt we could address both these needs by incorporating a drag and drop mechanic in a “master structure” of some sort which would show all the content in the course but also allow course creators to act on it.
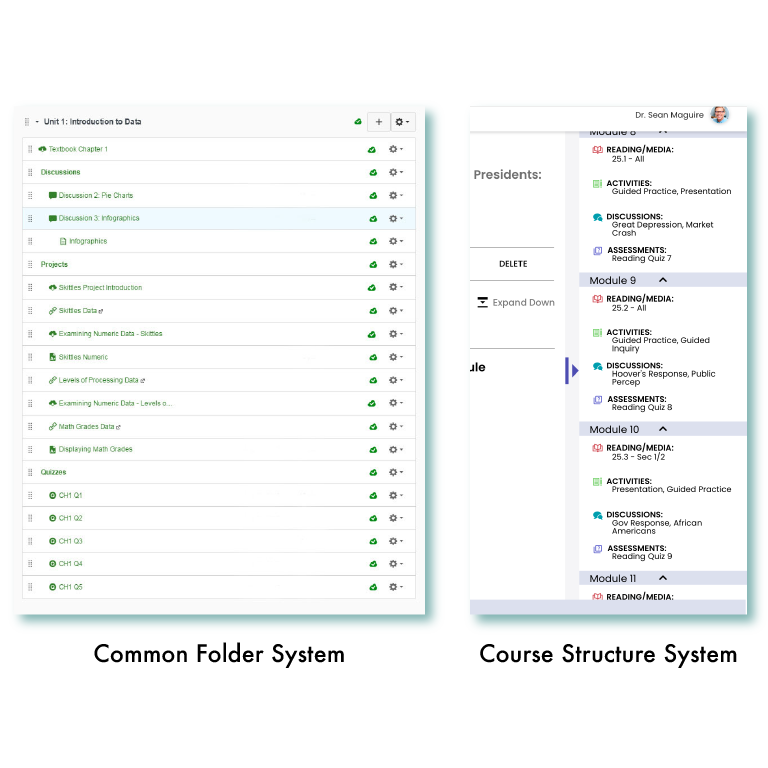
Relying upon a course structure with progressive encapsulations folds in the idea of a “path for learning” or “scaffolding” which helps course creators think about how students will move through content. It also helps make the learning science more inherent in the creation process.

Course components are classified and color-coded to aid in recognition across the course creation experience.
Content is forced to fit within pre-named component categories that correspond with how learning science structures the moving parts of a course. Since Sojourner has specific spaces built into the UI for these components, any blank spots will help the course creator decide if the omission of a component is intentional or not. For example, modules/weeks where presentations/finals are due may not need assignments or discussions.
AGENCY IN APPLICATION AND ADVANCEMENT
Early on, the team decided we did not want the push learning science onto course creators in an obtrusive way. The client shared an opinion that faculty tend to be stubborn and don’t want to be “told what to do.” Some statements during our user interviews support that:
“I think college professors are just kind of a stubborn bunch, anyway… and I don’t want to abandon the approach that I’ve had, that I’ve been using…” - Faculty member: Professor of Political Science / Male / Early 60s

The team’s “ANTI-north star.”
For reference, this is Clippy who is a discontinued “intelligent” user interface character from Microsoft Office. It generated a strongly negative response from users -to the point that the feature became automatically turned off in later iterations. It was eventually dropped from the product altogether. More info here.
We moved away from the initial client suggestion of “nudges” to analysis being completely optional on the course creator’s part via a button which is how the course design analytics, a first-to-market feature, was born.
HAVE YOU EVER FELT JUDGED BY AN INFOGRAPHIC?
In moving forward with a first-to-market “informational” feature, we developed a rough criteria of progressive success for implementation.
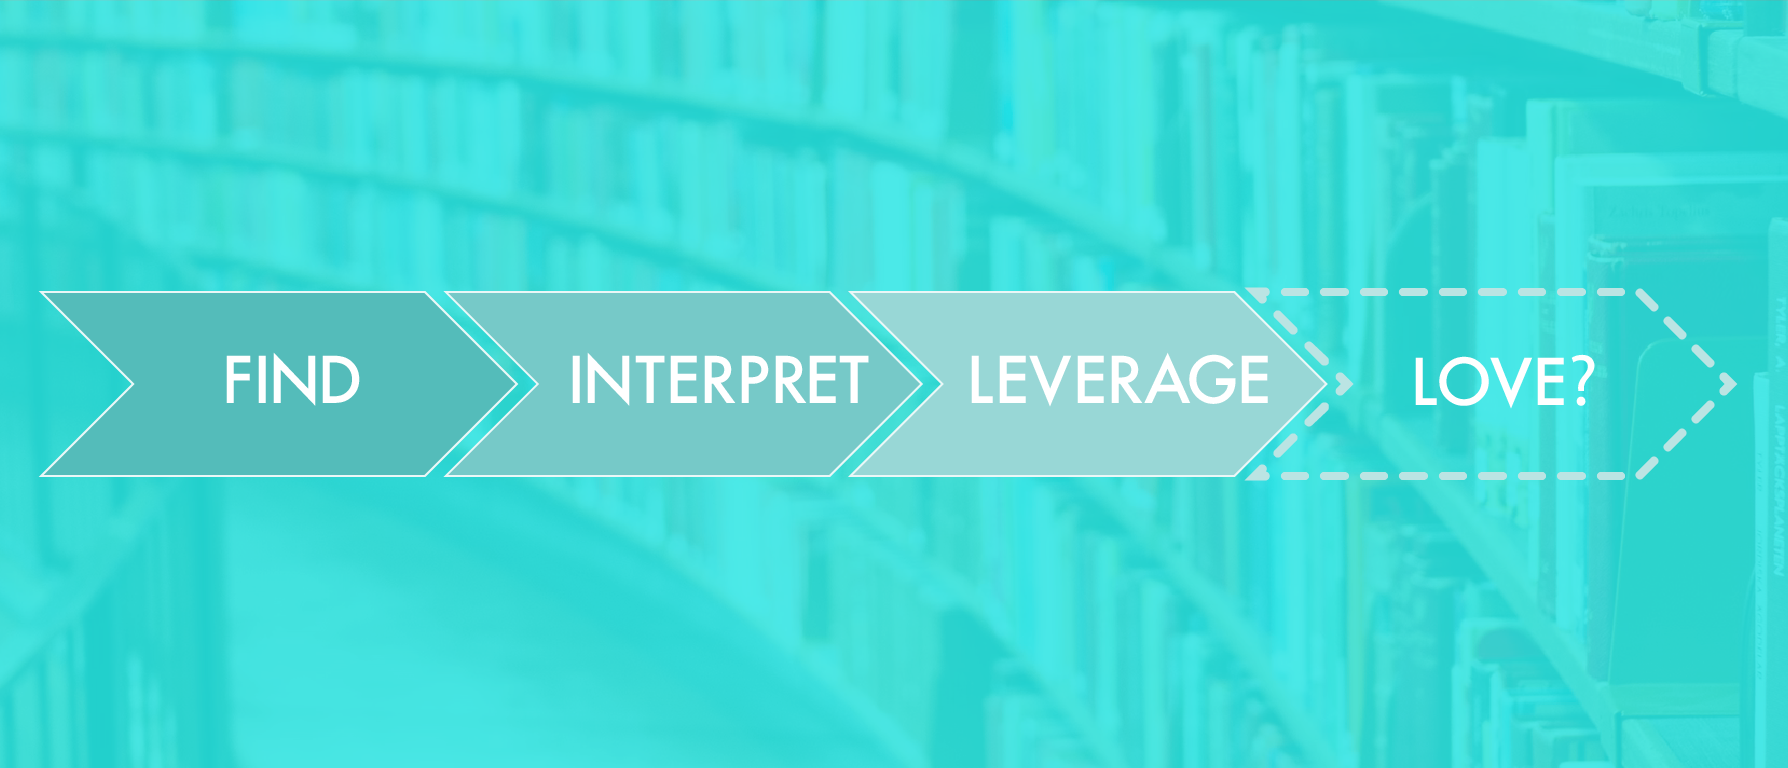
Find: Can course creators find the feature or information they are looking for?
Interpret: Can course creators understand what the feature or information is communicating to them?
Leverage: Can course creators use the information to achieve a specific goal?
…something we didn’t fully account for early on is the emotional dimension of the feature so we added another letter…
Love: Do course creators enjoy using the feature/information?

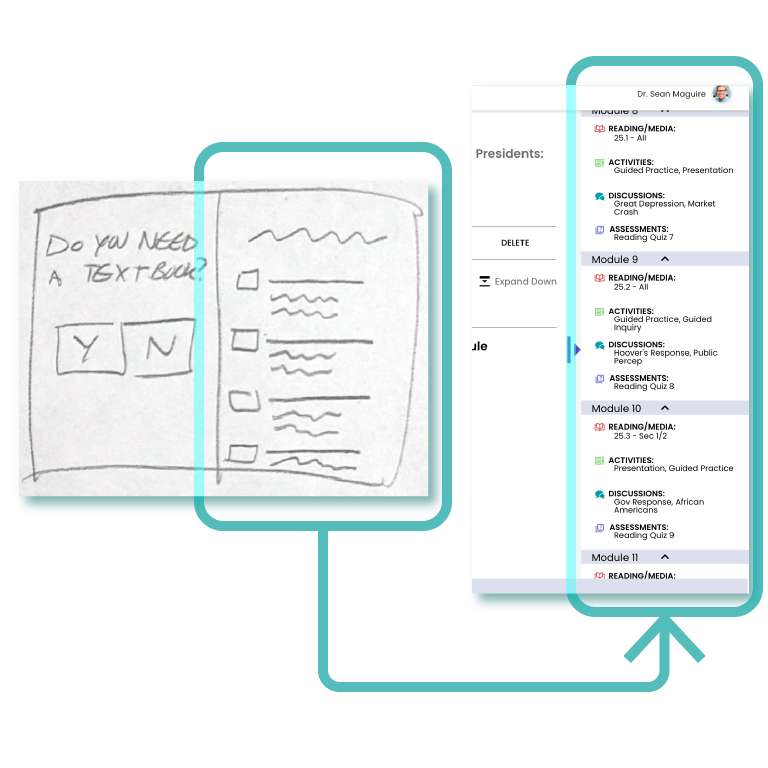
Sketch by me, early wireframe by Anne Costello
Early iterations of the product looked at communicating module/week alignment with a percentage; we received feedback that it felt like a grade which was negative. Also, the client gave feedback that with a numerical score, it would be very hard to create a defendable “algorithm” -one that college professors would be willing to trust.
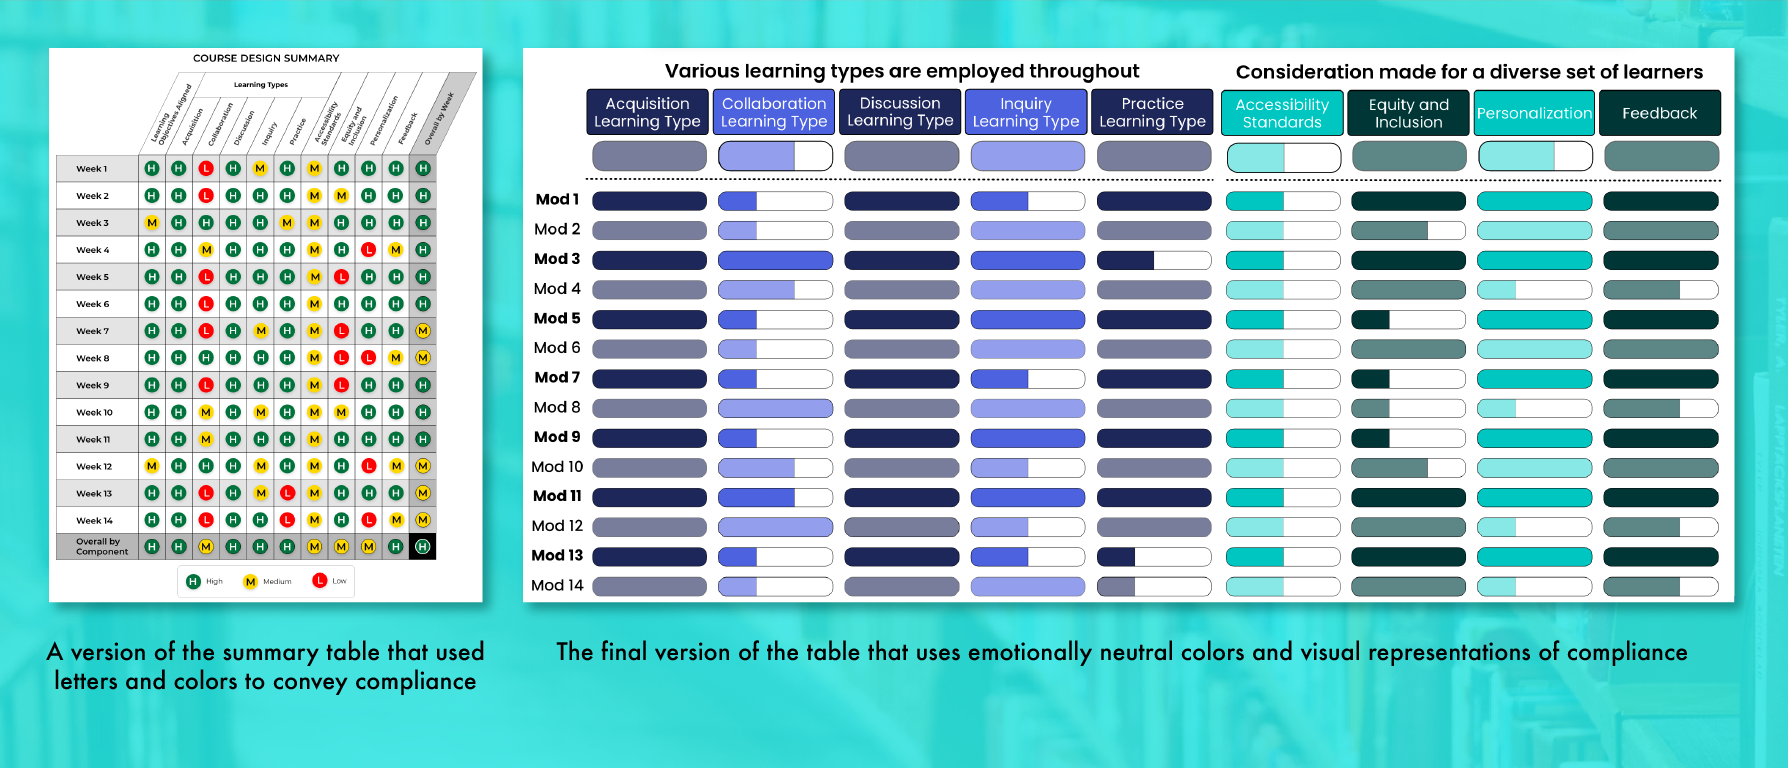
Course summary iterations by Anne Costello
Another iteration looked at using stop light colors and letters corresponding to “low, medium, and high.” Users reported feeling alarmed and a sense of urgency from the red/low readouts.
A more emotionally neutral solution was reached by using a purely visual readout for compliance and different colors.
INCENTIVES AND ITERATING ON ITERATING
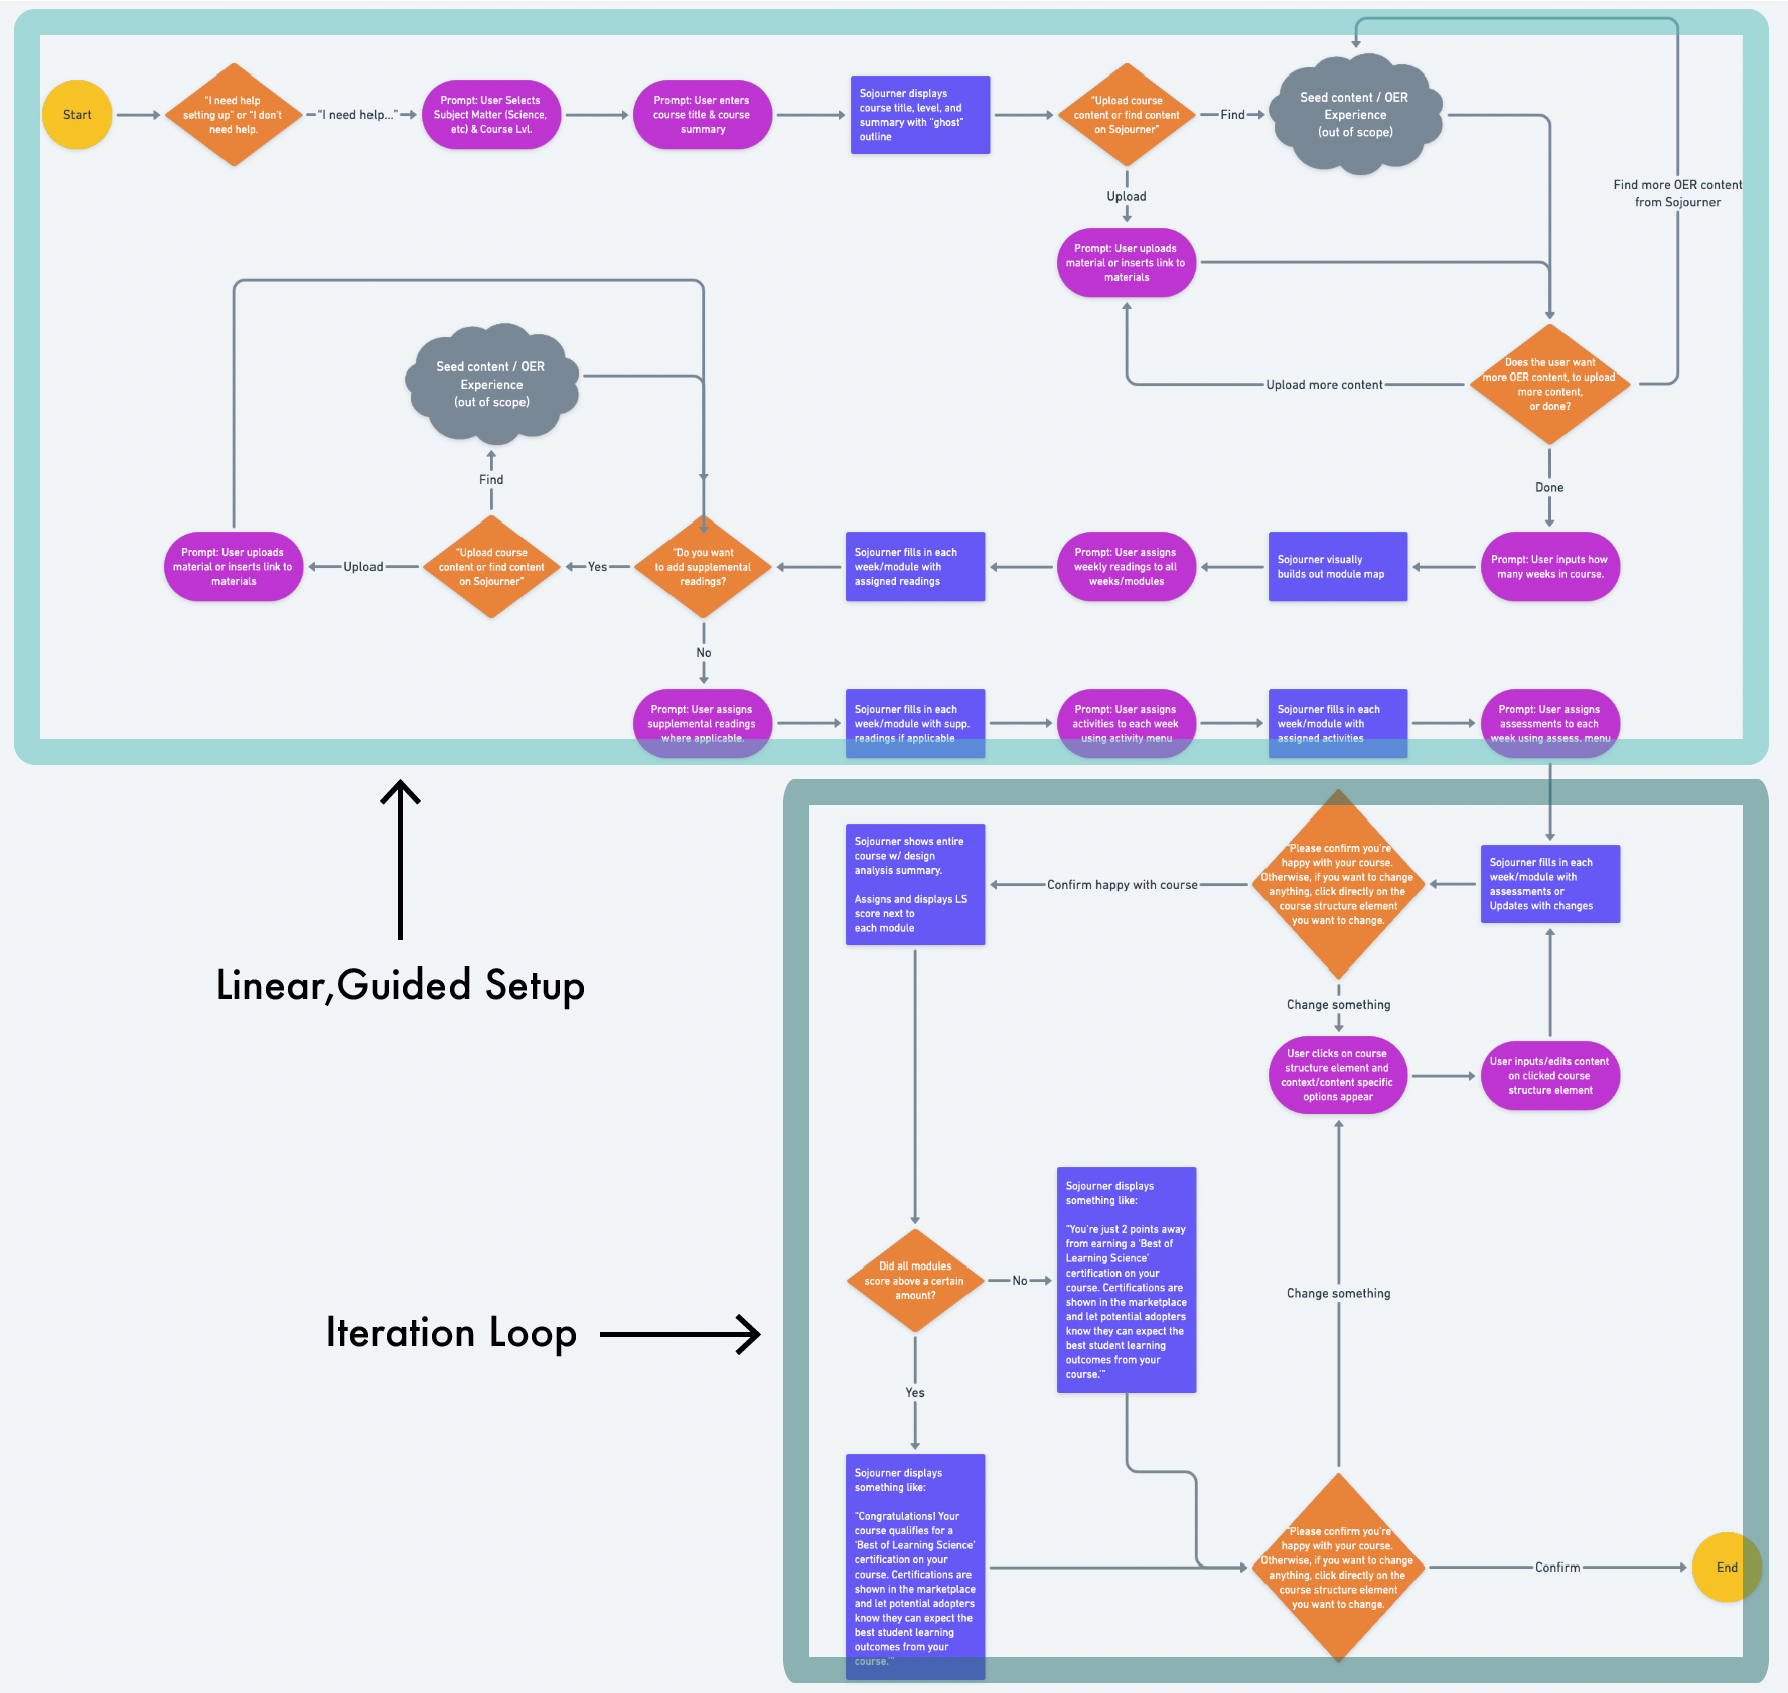
The flow can be accessed here.
Each team member ideated what the flow of course creation could be in the platform. Keeping in mind the faculty pain point of adapting and uploading content for course creation is time-consuming and difficult, I proposed a “wizard” experience that builds out the course structure through a series of prompts. The idea was to simulate an instructional designer guiding a faculty member through creating a course.

Some sketches I did showing how the idea might work as a 2-up layout of prompts on the left, results on the right.
The team decided to pursue an open, non-linear path for slotting content; however, the idea of the platform visually building out the course became the basis of the course structure side bar.
I also proposed that once content was fully slotted, a course creator could get feedback on the platform and receive a “score” of how well their course uses learning science. High scoring courses would receive a special “certification” on the marketplace.
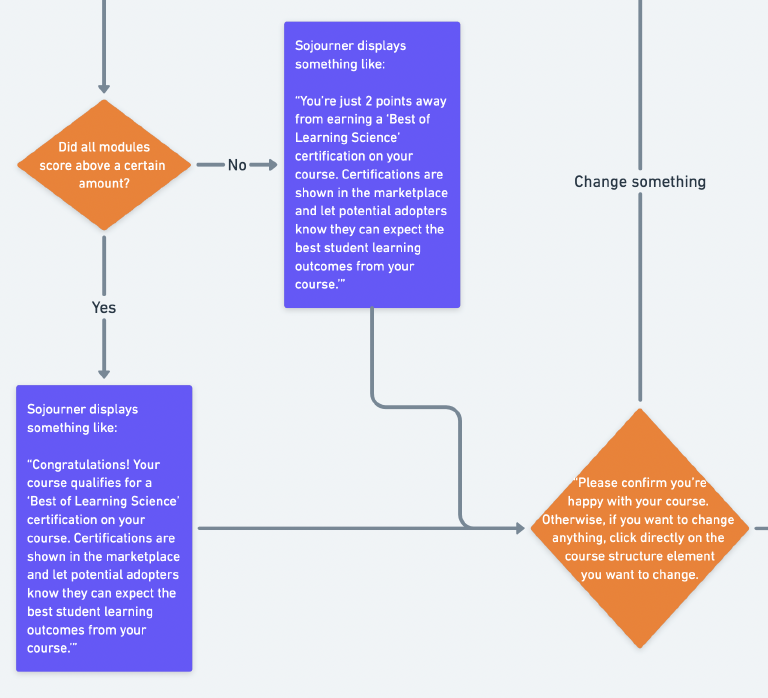
While it started as a monetizing strategy to incentivize the use and compliance with learning science, the idea ultimately went on to help inform the idea of course creators receiving feedback and being able to immediately act upon it.
What I especially found applicable about this idea is:
Course creators can fine-tune the design by iterating on the sojourner platform against the learning science analytics.
It’s similar to the way course creators incrementally improve their courses through receiving feedback from learners.

Left: Teaching Feedback Loop - Create, Teach, Learn
Right: Sojourner Feedback Loop - Create, Analyze, Learn
USABILITY TESTING
METHODOLOGY
Our testing plan centered around 3 main questions (reasonings are below):
Will participants understand drag and drop as a way to assign content?
If successful, we planned to reuse this pattern across the platform as a means to make the interface more intuitive and user-friendly.
Will participants understand the course design analytics feature?
As a first-to-market feature, we wanted to gather “task- success” data as a benchmark for later development by asking if participants could explain the meaning of the displays or find the explanations on the page.
Will participants find the course design analytics feature useful?
We felt it was critical to get measures on this since it directly touches upon Argos’ value proposition.
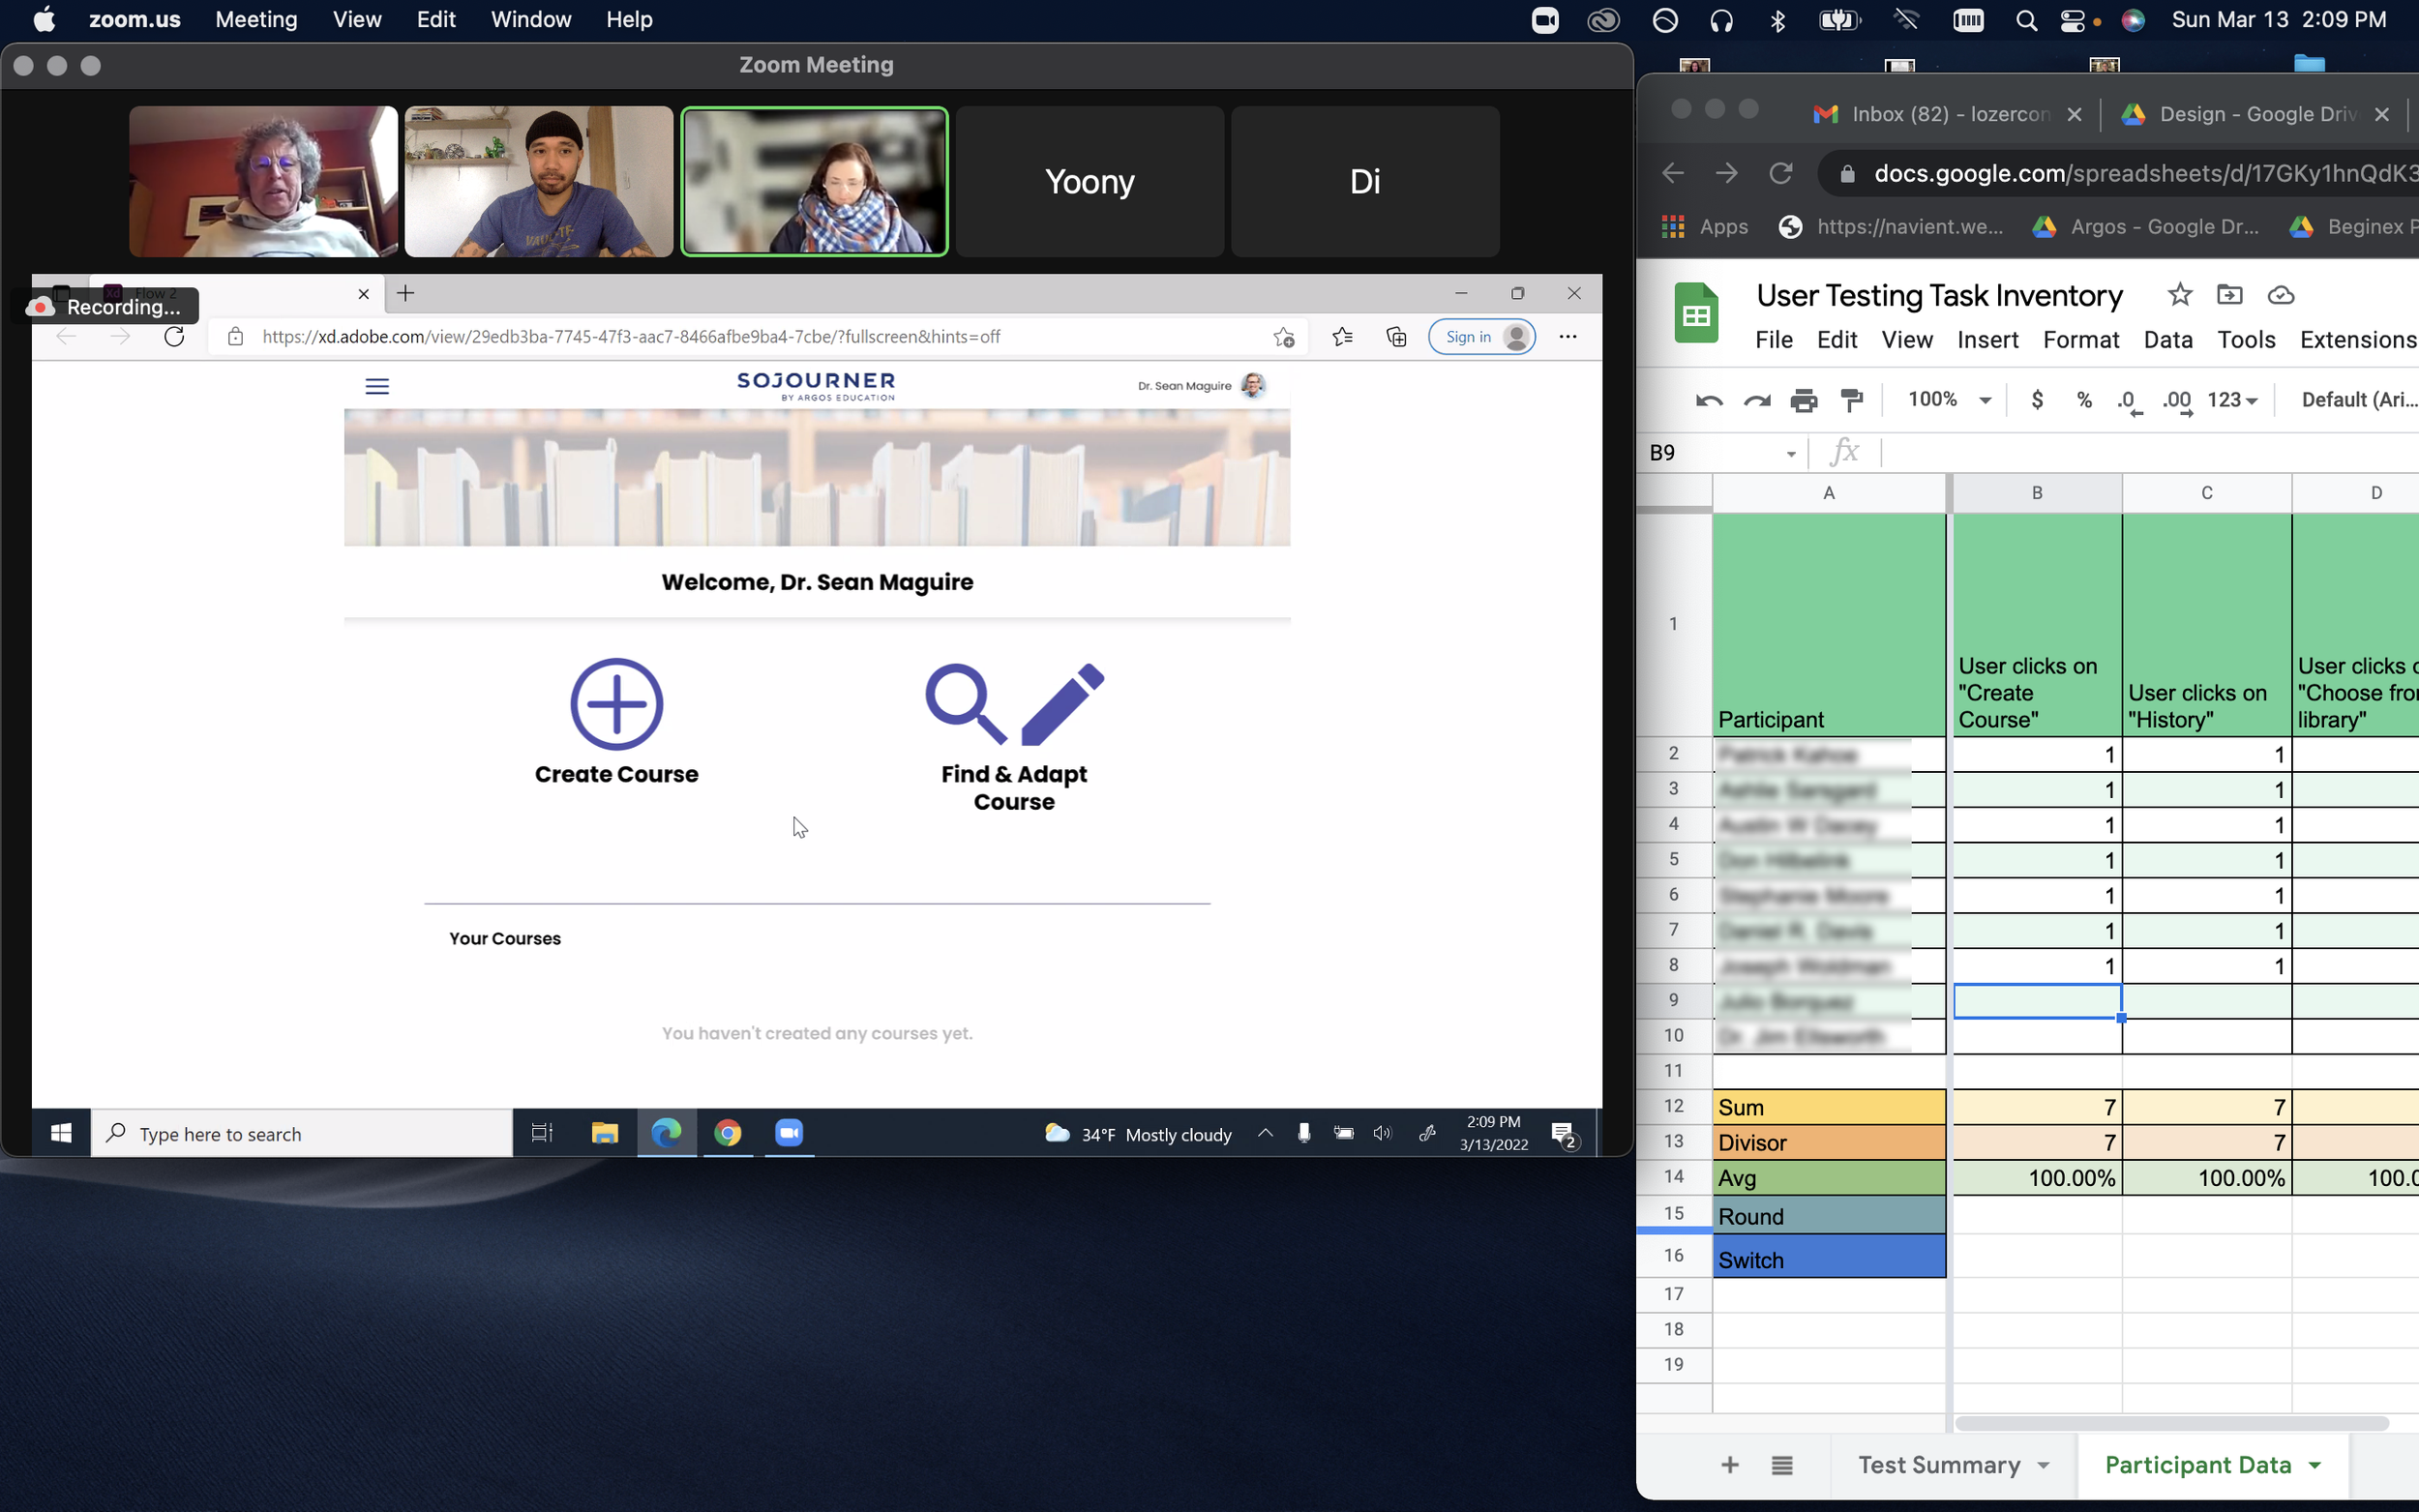
9 participants shared their screens on Zoom as they went through the prototype and completed tasks while we prompted them to think aloud.
We also had them answer 4 attitudinal questions to help get a measure on what they thought about the analytics feature.
RESULTS: AREAS OF SUCCESS
Overall Usability:
Feels Clean
Easy to use
Highly intuitive
Course Set-up
Structure is easy to understand
Sidebar is useful
Appreciate collapsible feature
Design Analytics
Valuable tool
Learning opportunity
10,000-mile view
Quick edits

Attitudinal Measures
Helping verify product-market fit
"How likely are you to recommend this product to others in your field?"
Likely (avg 3.8/5)
"How likely are you to consider switching to this product?"
Likely (avg 4/5)
"How innovative do you find this feature?" (learning analytics)
Very Innovative (avg 4.79/5)
"How relevant is this product to you?"
Very relevant (avg 4.5/5)
RESULTS: OPPORTUNITIES FOR IMPROVEMENT

Users had a hard time reading the small font used on various dashboards, buttons, and the course structure sidebar.
Font size now has a minimum size of at least 16 pt across the whole product. Hover states that show component details are employed to provide more space on the table which increases readability.
"Awfully small so having a hard time reading it."
-Faculty

Less tech-savvy users lacked confidence in which items were clickable, draggable, or could be scrolled.
Actionable items were redesigned to have obvious affordances to communicate what they could do. Example: Clickable text was replaced with buttons.
“What happened there?
How do I know what I just did?”
-Faculty
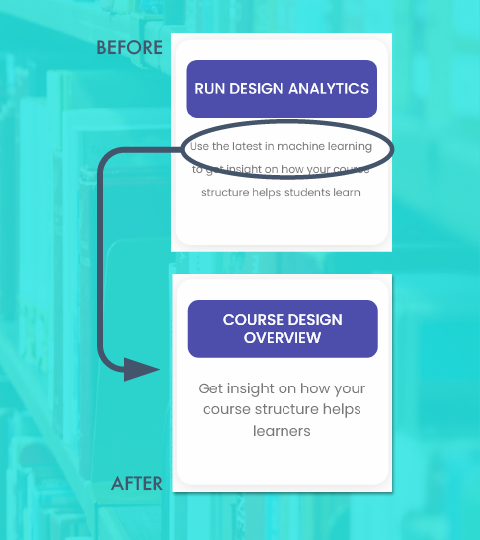
Faculty-type users reacted negatively to the terms “Design Analytics” and “Machine Learning.”
The feature name was changed to “Course Design Overview” and language that emphasized technology was replaced with language that emphasized improving learner outcomes.
“I could feel this controlling me.”
-Faculty
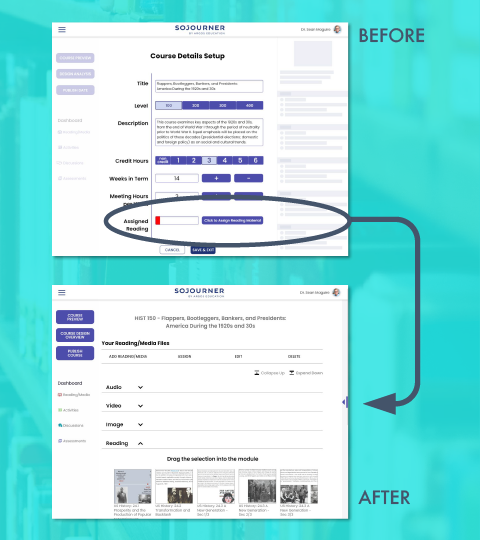
Most users were confused by the placement of the “Assign Reading” portion of the module.
Several users felt a negative reaction to the red color in the progress bar.
We created a separate “Add Reading/Media” flow as part of the main course building and removed the progress bar.
“Je**s Ch**t! It’s red!”
-Faculty

Users found the summary table overwhelming and were unclear on the meaning of “high/medium/low” on data displays.
Progress bars replaced the letters for levels and an emotionally neutral color palette replaced the “stop light” colors. Info is first presented at a summary level with the option to deep dive into the granular data just a click away.
“Okay, so my first impression of this is that it’s overwhelming… It’s a lot to take in… It’s extremely colorful.”
-Instructional Designer
Faculty-type users weren’t sure of how the data in the various displays were derived which led to distrust of the data.
All data displays now have an explanation of the data’s origin.
“It’s going to bug me- Where did it come from? It’s awfully precise… This gives me a sense of false precision.”
-Faculty
QUALITATIVE FEEDBACK… FROM THE CLIENT
Since the client asked us to completely rethink the course creation experience, we didn't have baseline KPIs to quantify how successful we were. However, the client feedback after the case study presentation and final demo were as follows:
“Was it a success? Overwhelmingly so. Every week we were excited to see what you’d come to us with.”
“I really like how you thought about the platform as a tool for professional development. You’ve really captured the way we like to think about it. The way you guys just thought about and went about things was just really smart. Really smart.”
"You’ve definitely expanded our thinking about something we’ve been struggling with."
"You have definitely taught us something new"
"In all seriousness, if we had more funding, we’d be offering you on-staff positions"

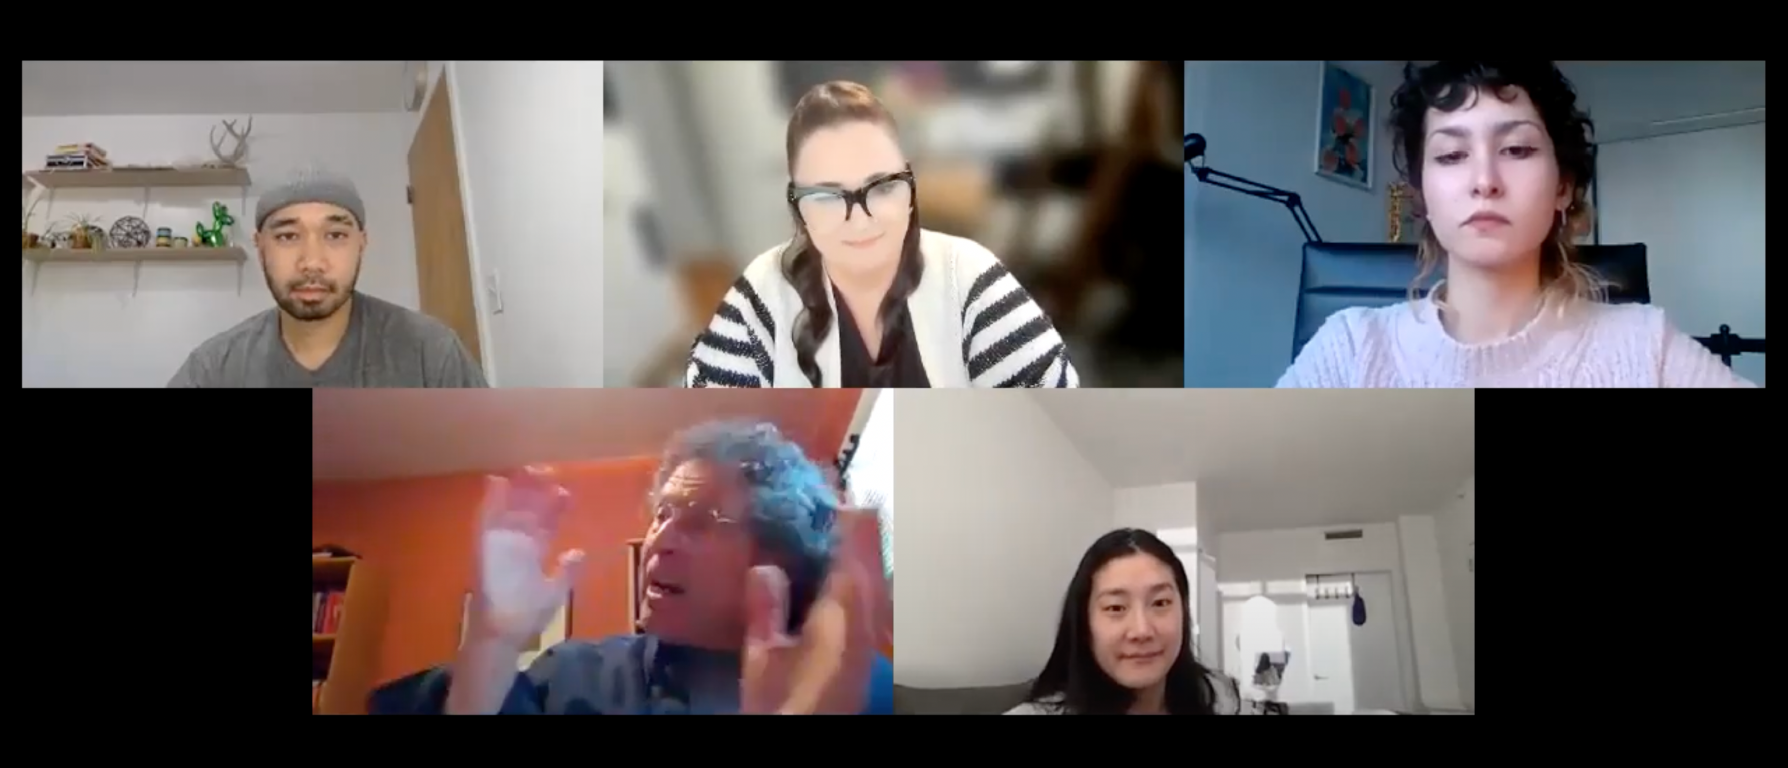
The team meeting w/ the client post presentation
NEXT STEPS
The 10-week challenge my team and I tackled represents a small piece of Argos’ vision of a creator economy platform for course creators. Further cycles in the UX process would focus on fine-tuning the new course creation flow while considering how this flow interlocks with whatever comes before or after.
Research:
more empathy interviews and usability testing sessions with “pure” faculty-type users
to learn how to position and talk about learning science as a means to drive greater adoption
interview a wider variety of subject matter course creators
to see how subject matter may or may not affect the course creation process
test the most up-to-date prototype with a “real” task
to establish benchmarks to better track usability over iteration cycles
Design:
create the “find & adopt” path of course creation
a few faculty members said they would want to “get the lay of the land” or normally work off an existing course
define what the OER selection and other content selection experiences could be
use of OER is critical to Argos’ plan to supply content while minimizing student costs
tweak or alter the course creation experience to connect with other planned user task flows
to start supporting longer user journeys and move closer towards fully realizing the monetization model
WHAT I LEARNED

A screen grab from the team’s 1st group meeting: attempting to parse through the project handoff data
PUT YOUR CLIENT ON SPEED DIAL
If qualitative feedback and iteration are part of the secret sauce that helps course creators incrementally improve their courses… these two ingredients also proved vital in moving our UX process along. The weekly touch bases with the client proved essential in keeping the project in line with their business objectives while also helping to close the iteration loop faster -thereby accelerating the development process.
BEING STRATEGIC ABOUT USER RESEARCH IS A MUST
The time with users is never enough so it was vital to understand how our user research would help enable addressing the business goals of the product. This was especially important to consider since the team had to do so much generative research to build out product criteria for an experience that didn’t exist.
CLIENTS HAVE ASSUMPTIONS EVEN IF THEY ASSUME THEY DON’T
When the team kicked off the project, the client briefed us with their understanding of who course creators are and what they do. While a lot of what they communicated to us seemed to be validated in our research, there were some important aspects that were invalidated in the same body of work. The takeaway is: Trust, but verify.