
Sojourner
A web-based edtech course creation platform with
first-to-market features
CLIENT

Founded in 2021, Argos Education, an edtech startup, seeks to build a platform that allows educators to leverage learning science while creating custom textbooks and courses that can be bought and sold in a marketplace.
PROBLEM SPACE
Textbooks are expensive, and students and faculty may only use a small portion of them.
Postsecondary faculty receive no training in how to instruct.
Postsecondary faculty are not very tech-savvy and have trouble using existing course creation software.
BUSINESS NEED
The ability to create courses on the platform is essential to Argos’ business model, and they did not have an existing experience that met or exceeded existing market expectations.
CHALLENGE
In 10 weeks (Jan 2022 - March 2022):
“Create an intuitive and effective way for creators to set up course goals, outline the course, prototype units, add content, fine-tune the design and test it with early adopters”
OUTCOME
My team and I created a validated course design experience that incorporated the client’s unique value proposition as a first-to-market feature set.


“I really like how you thought about the platform as a tool for professional development. You’ve really captured the way we like to think about it…” - Argos’ client team
MY ROLE
I worked in a team of 4 as co-facilitator. My contributions are detailed in the project’s phases below.
Process
Client Kickoff
The Argos’ client team discussed their existing product and intended market.
The team learned Argos is targeting 2 types of users: postsecondary faculty and instructional designers.
Instructional designer create courses using learning science which are validated best practices that maximize learning outcomes.
We also learned the following which informed the product design criteria:
Client Assumptions:
Instructional designers use quantitative data to improve course design. Faculty could also be doing this.
Nudges and active recommendations can change course creation behavior.
Client Product Goals:
“We want [our product] to make teachers better.”
“….provide scaffolding for educators.”
“…learning from the ‘book’ & class to be more connected.”
When asked “How will we know if this project is a success?” the client responded: “If you can teach us something new.”
Comparative Analysis
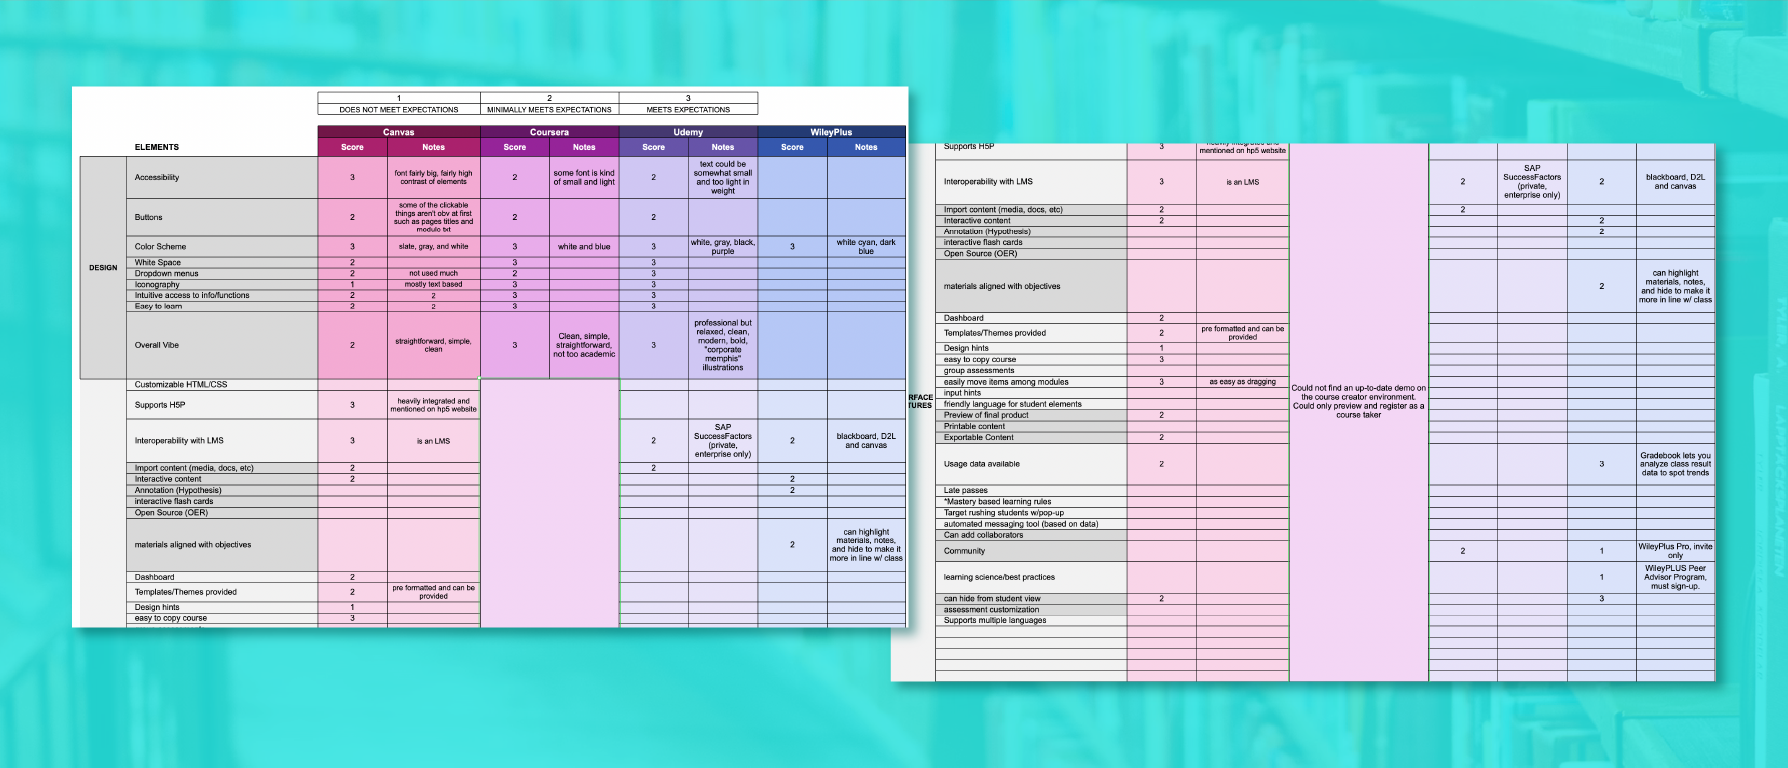
Blank entries are due to not being able to directly interact with the product. For instance, evaluating error handling would be impossible to access in a sales demo.
We performed a comparative analysis and heuristic analysis with the goals of:
Define the minimum feature set needed to compete in the courseware space
Gain an understanding of the general usability involved in current course creation flows
Map the existing landscape to understand where Argos competes
Solution:
Data was gleaned from available webinars, demos, and instructional videos from Youtube.
Challenges:
All the competitor products required university affiliation for access. Requests for demonstrations went unanswered.
Findings:
No one is making the learning science easily accessible
Menu and “course” nav on left, editing menus in top of right
Material organized into modules/units with formative and summative assessments
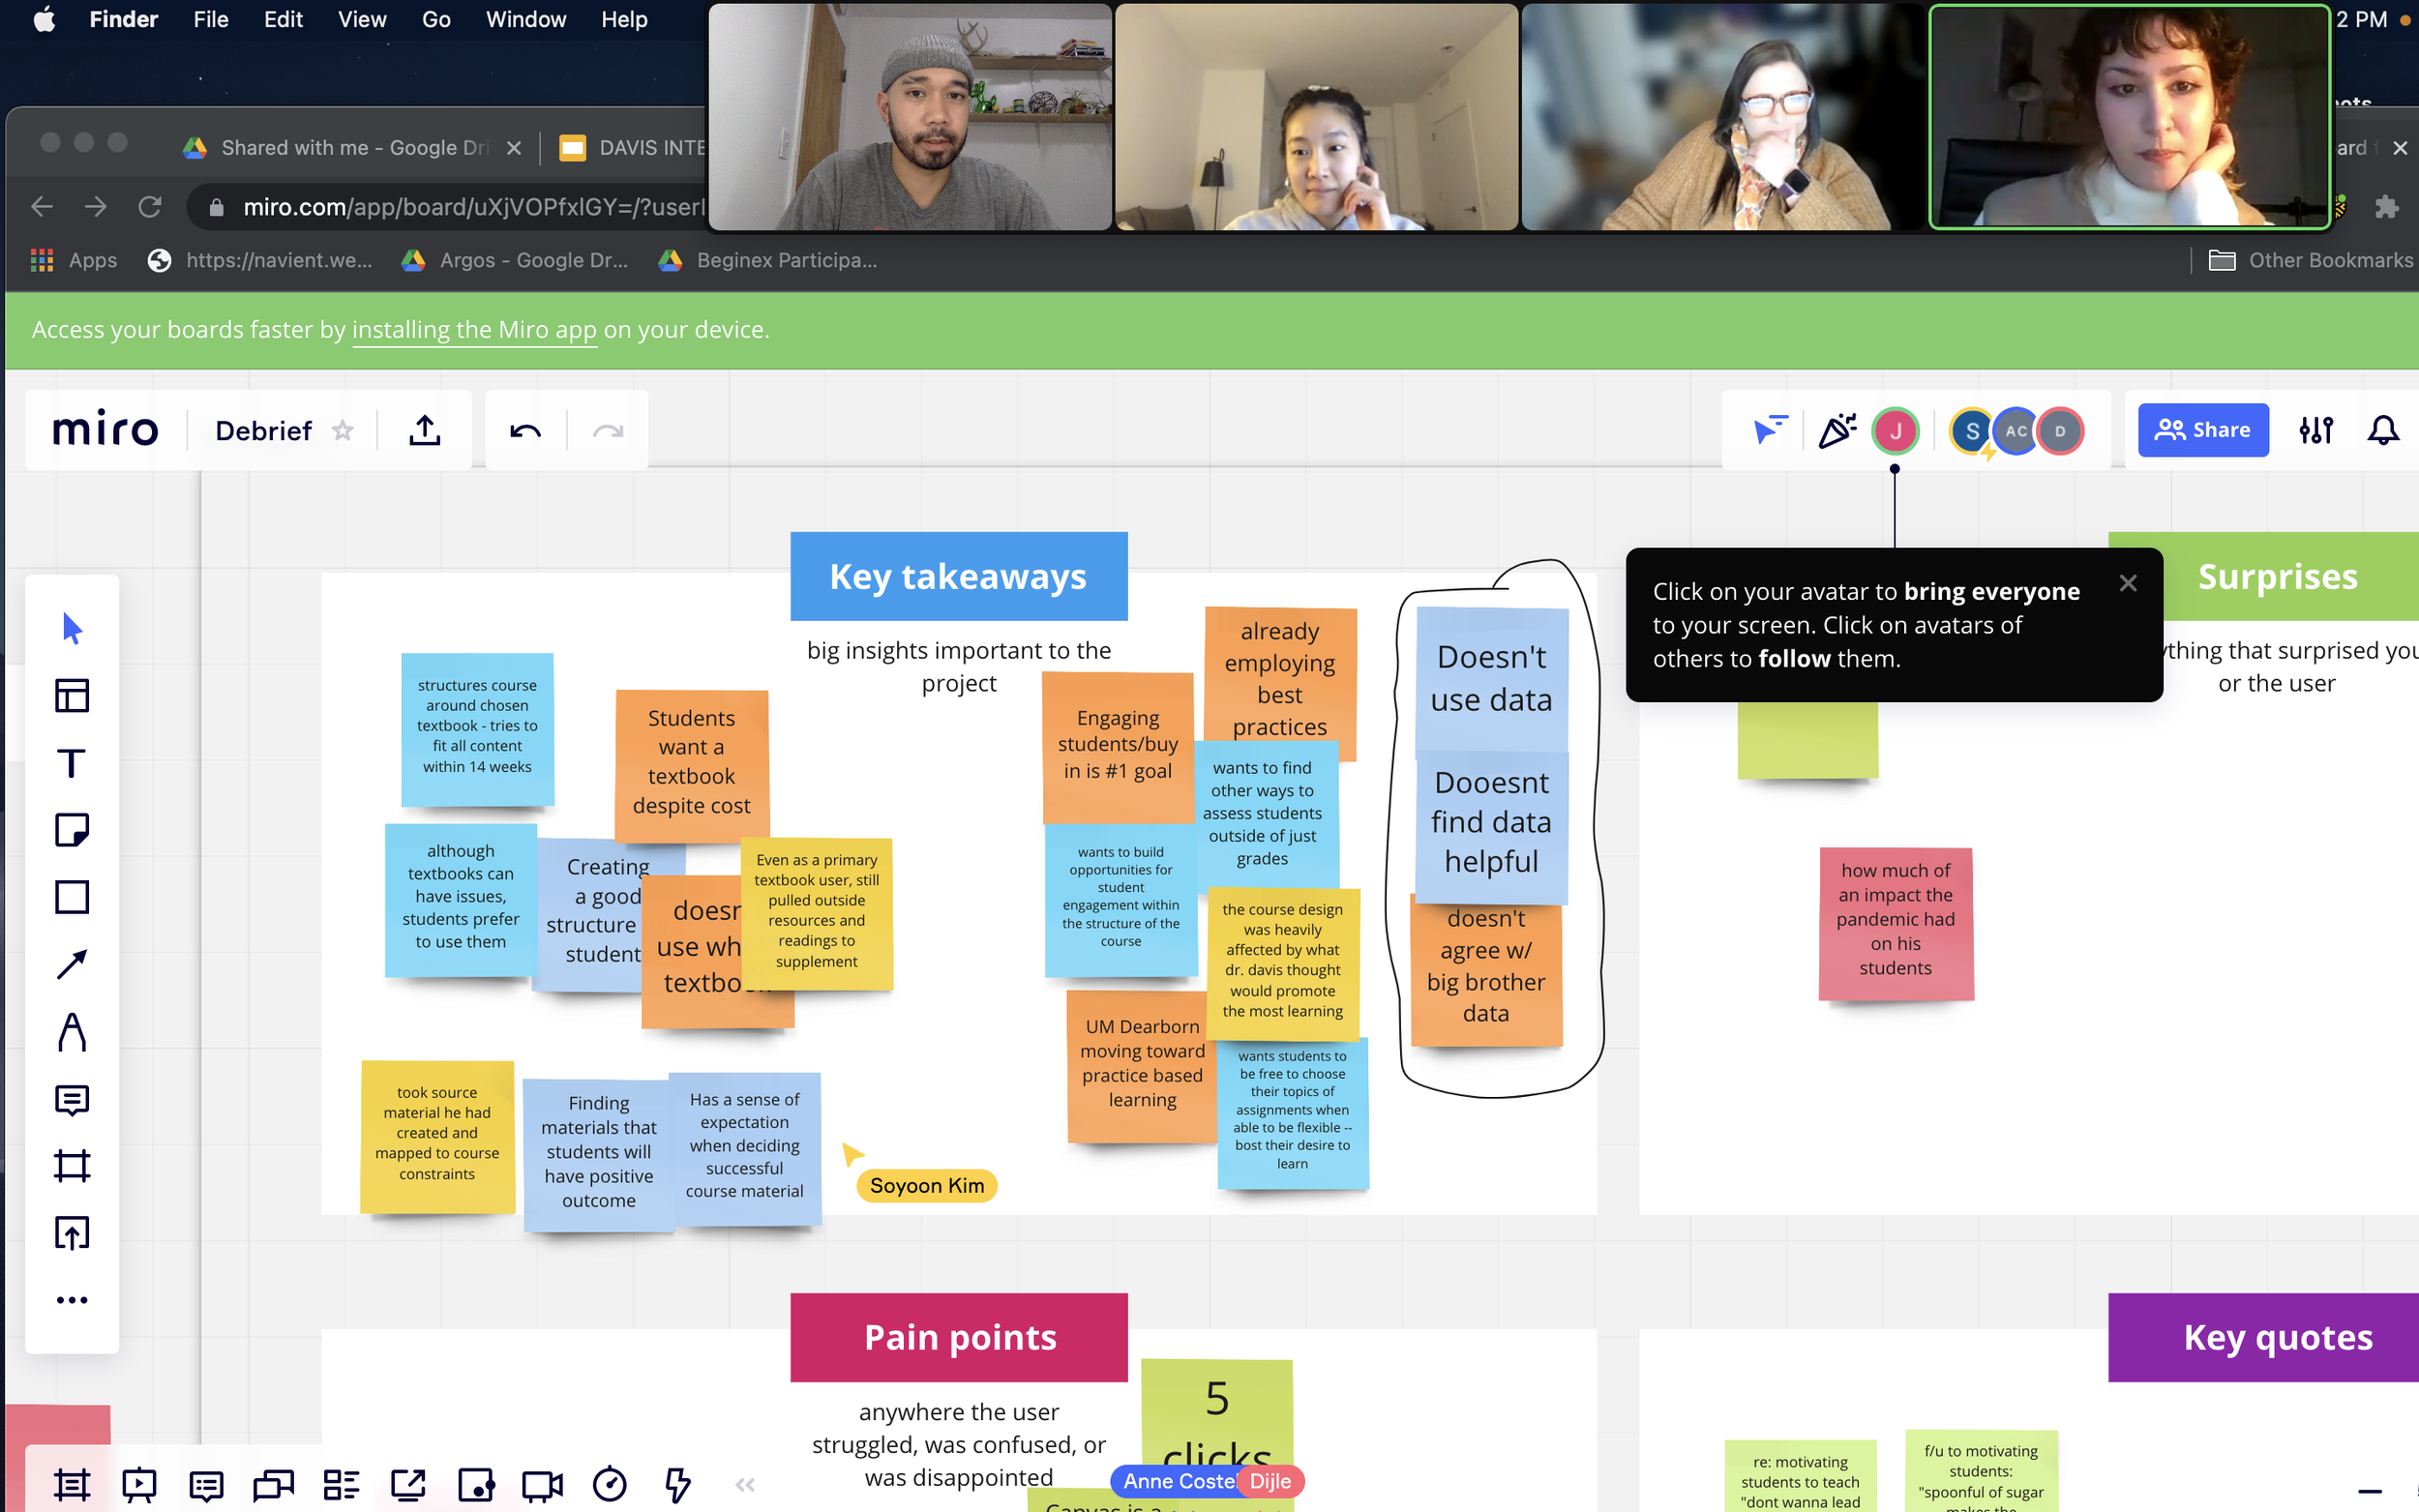
Empathy Interviews
The team interviewed 9 participants representing a mix faculty/instructional designers.
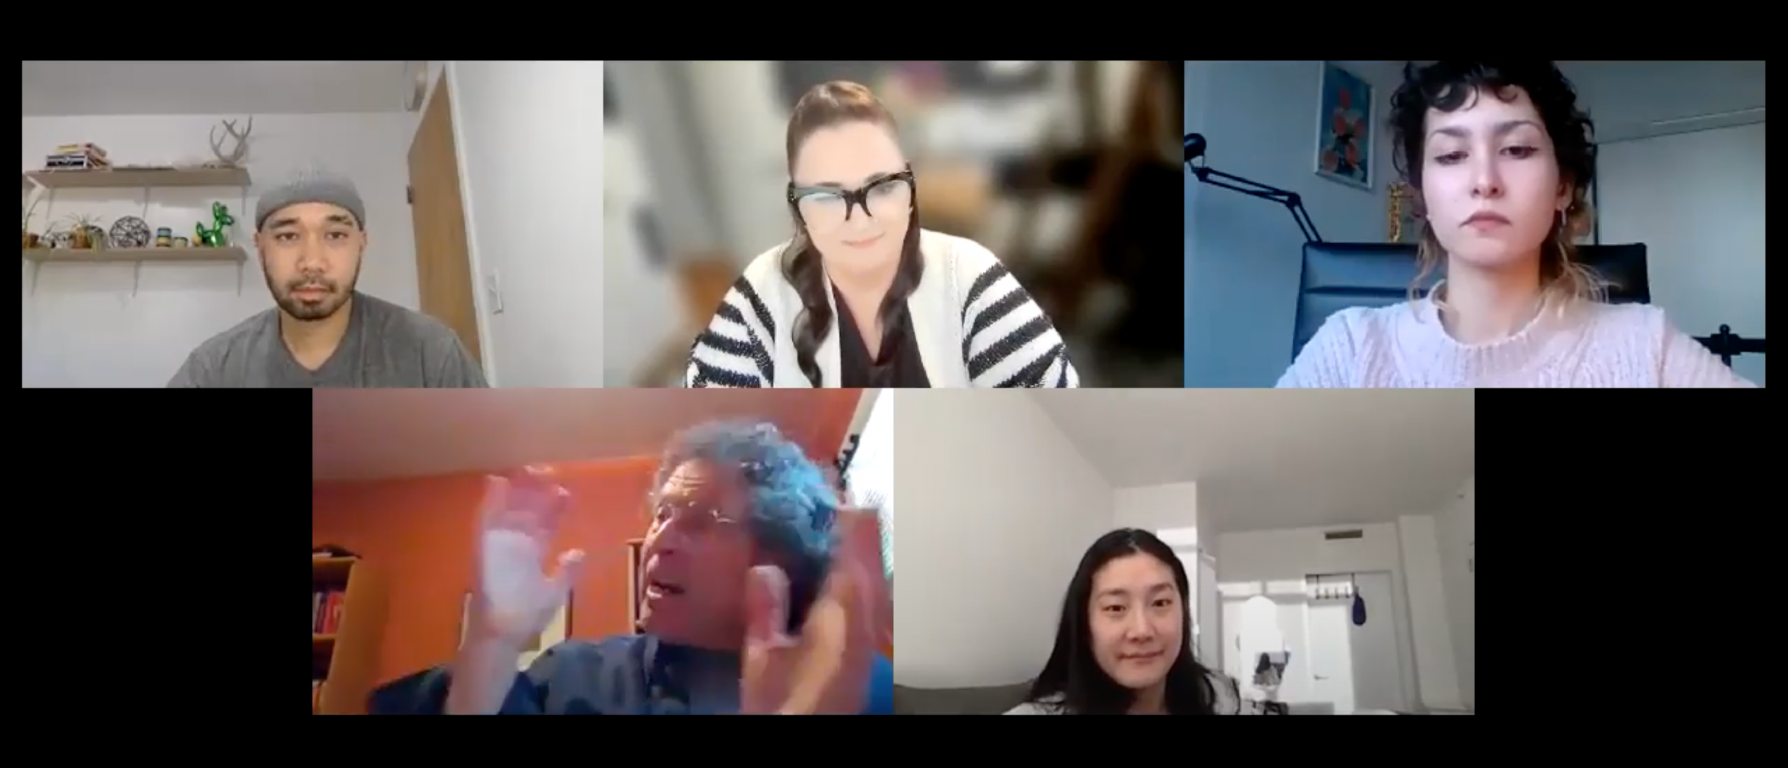
The team during one of our empathy interview sessions
The competitive analysis helped inform the interview script regarding asking about specific features and how tasks are accomplished.

Using goals to guide the creation of user interview questions
a major Discovery
We uncovered an insight which challenged one of our client’s user-behavioral assumptions:
Regardless which persona type each participant fit into and their level of tech savviness:
Qualitative data was used to assess how well the course was being received by students, not quantitative data.
Our client was stunned. Part of their roadmap is to use quantitative data to drive course design improvement.
“I use the pain of the previous class to inform the design of the next.”
Faculty Member: Professor of Linguistics / Male / Early 60s“I would rather just work on developing relationships… and use my ability and intuition as an instructor.”
Faculty/Instructional Designer: Associate Director, Learning Experience Design / Female / 46
The finding informed us that course design is influenced by an iterative, qualitative data feedback loop with learner cohorts.
Narrowing down opportunities

The team came up with 5 key insights which we reframed as design opportunities.
We selected the three highlighted opportunities as a means of staying within scope given the timeline of the project.
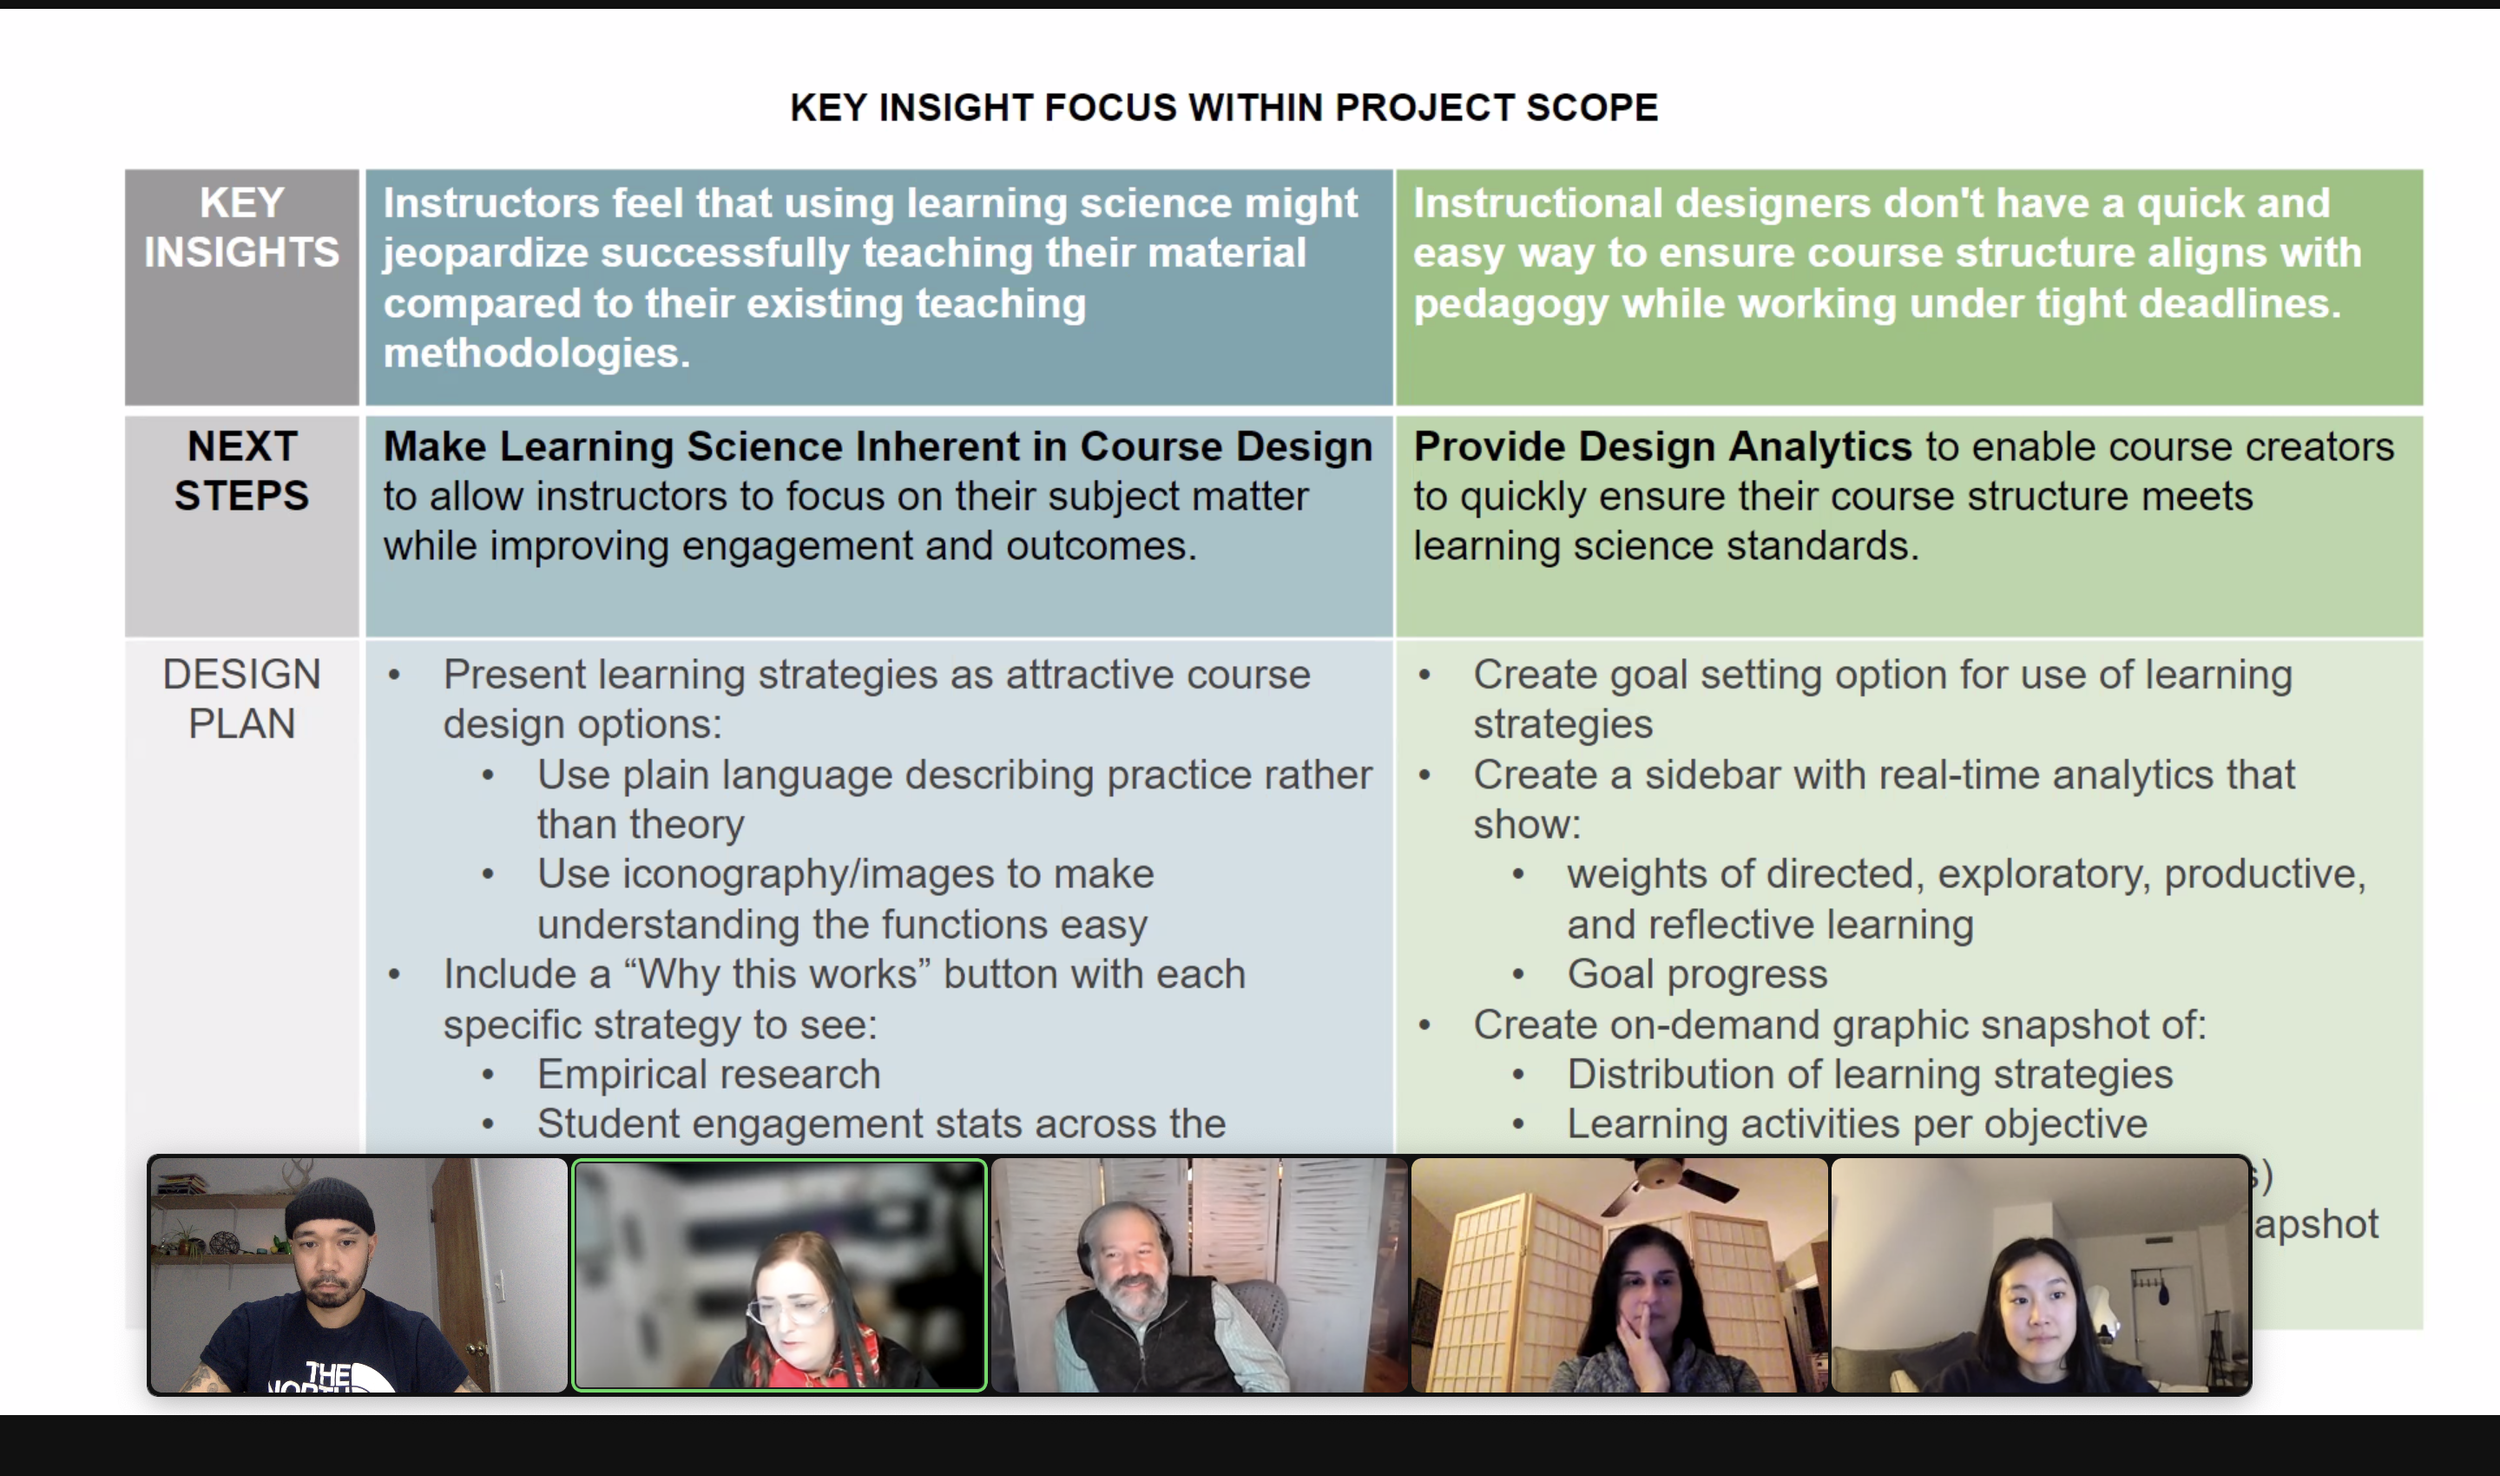
Meeting with the Argos client team to discuss scope and areas of opportunity to address
These three opportunities most closely addressed Argos’ value proposition and the product goals we elicited from our client meetings.
Ideation
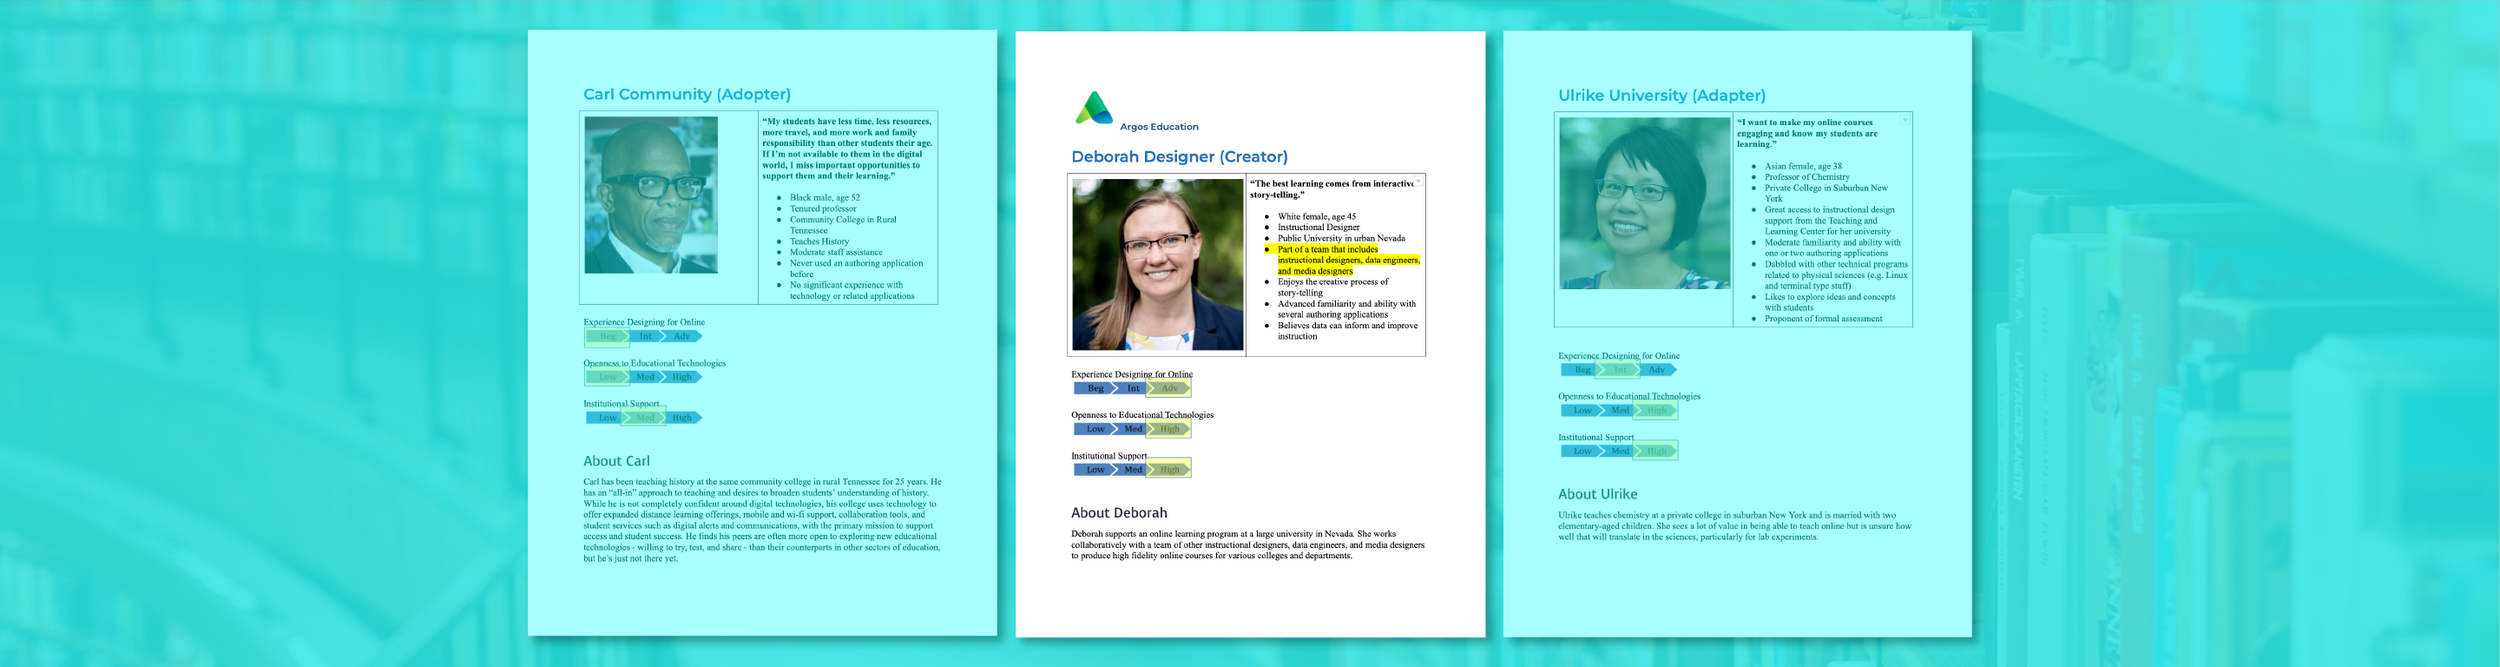
During our research synthesis phase, we crafted personas to help guide and assess the team’s concepts and ideas.

This was helpful to keep in mind as the two personas have very different levels of comfort with using technology and learning science.
To generate the most possible ideas in the least amount of time, each team member created an idea of what the new course creation happy path could be.
After agreeing on a master flow for course creation, each team member sketched ideas for different parts of the experience.

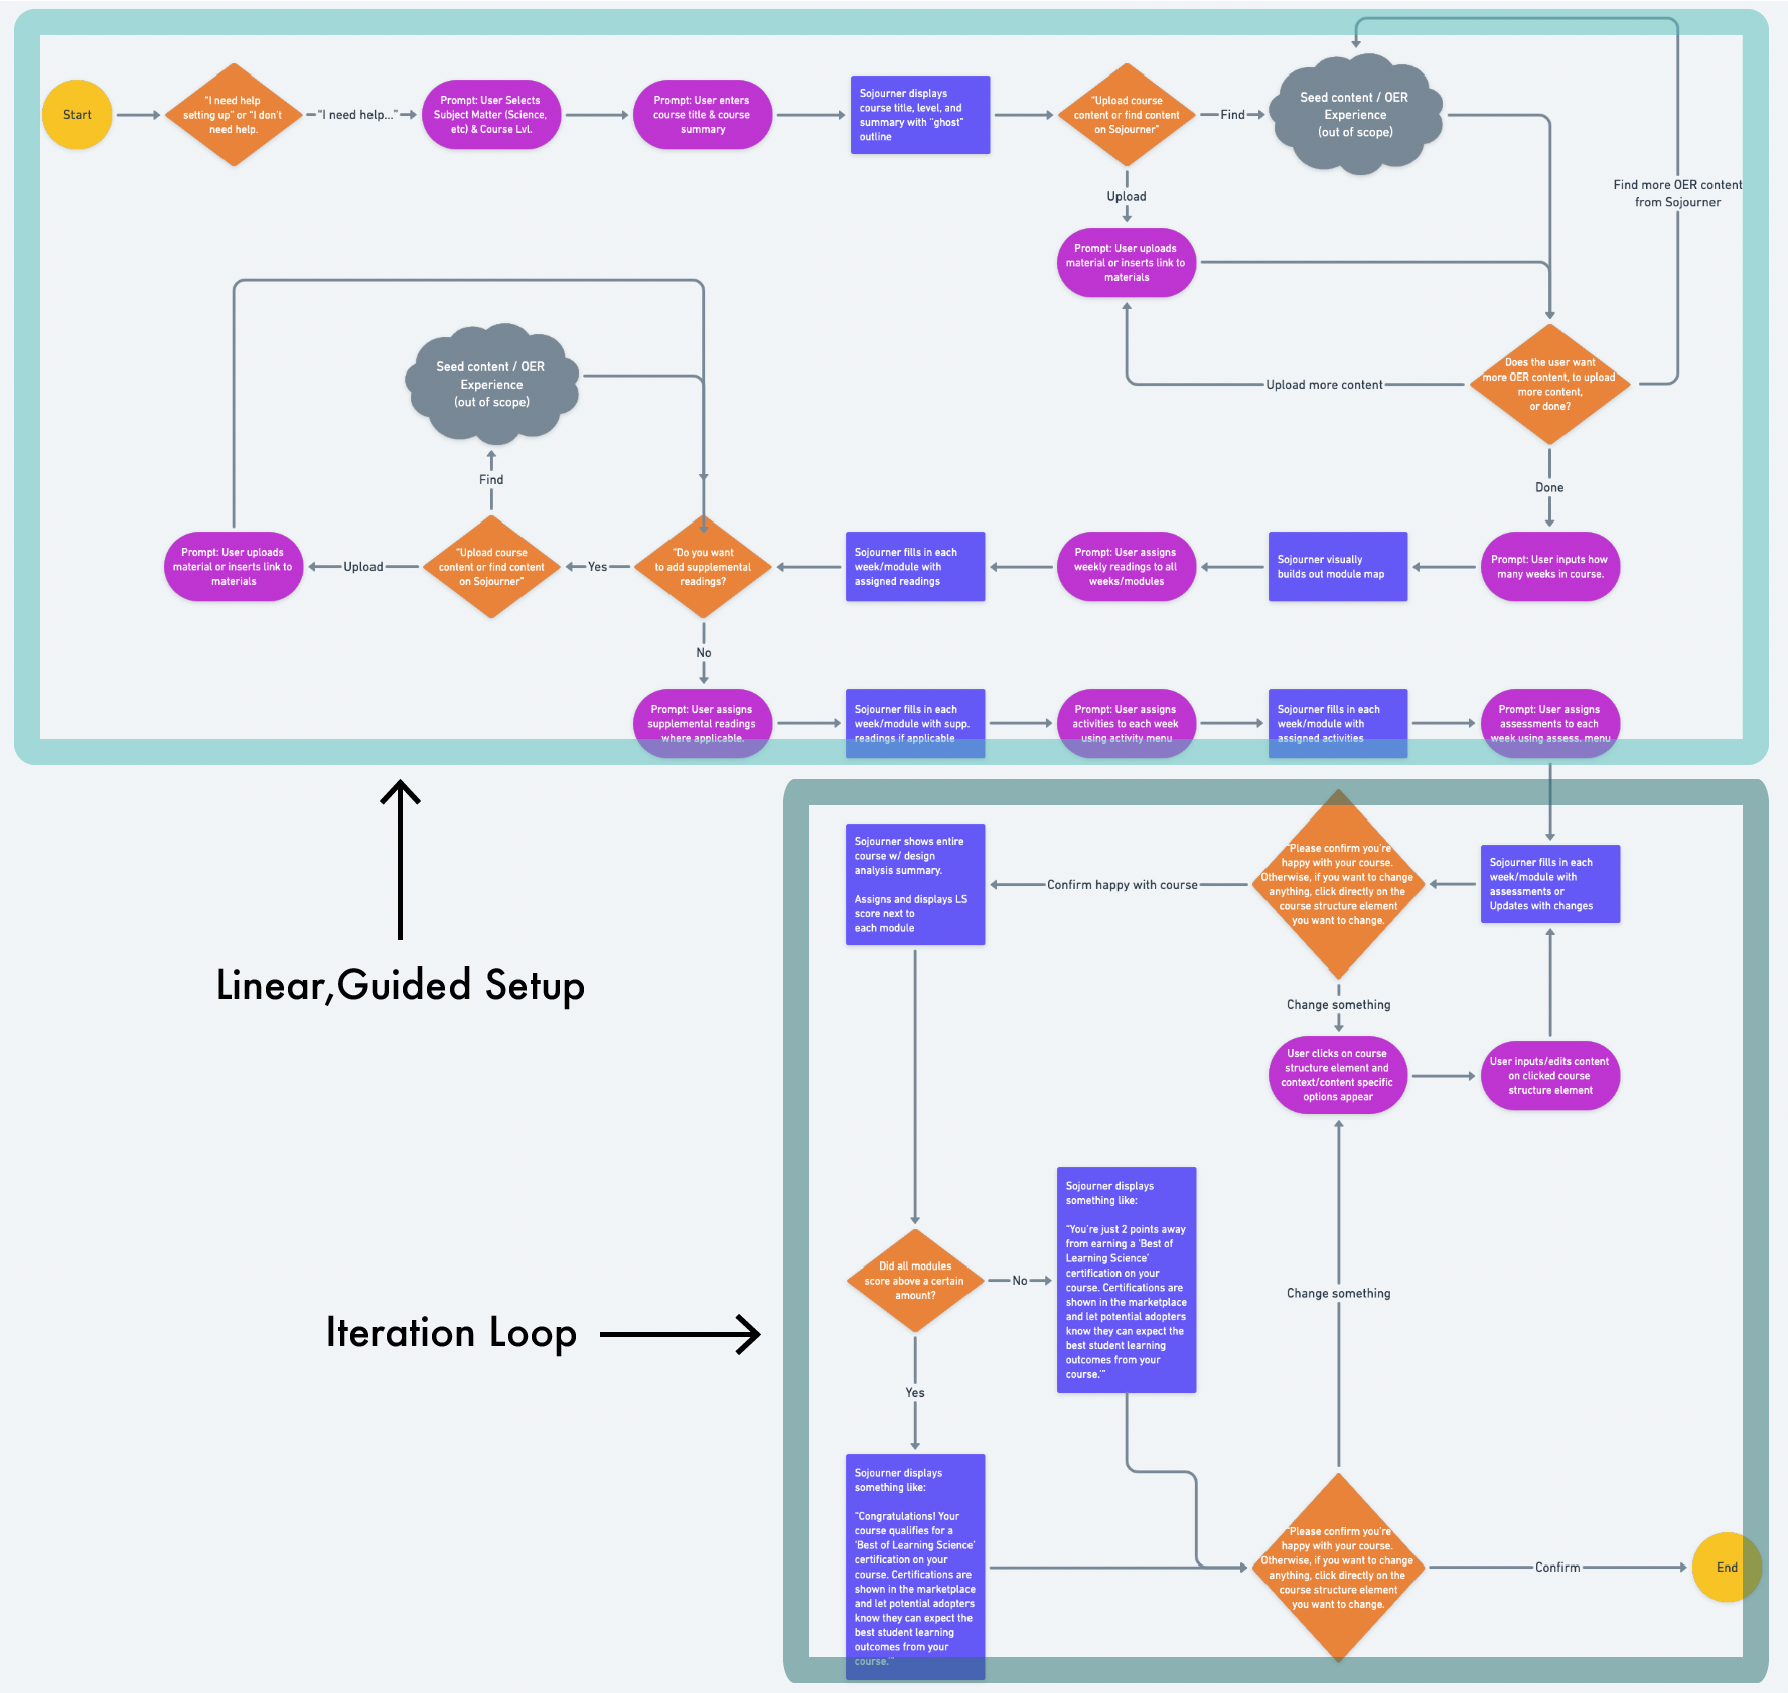
Prototyping/Usability Testing
The team worked together to build out a prototype that incorporated an early version of a style tile so we could also test look and feel with our participants. We built out the sub-flows that would test critical assumptions and dependencies for our designs.

A snapshot of some of the flows and screens the team created
Methodology
Our testing plan centered around 3 main questions (reasonings are below):
Will participants understand drag and drop as a way to assign content?
If successful, we planned to reuse this pattern across the platform as a means to make the interface more intuitive and user-friendly.
Will participants understand the course design analytics feature?
As a first-to-market feature, we wanted to gather “task- success” data as a benchmark for later development by asking if participants could explain the meaning of the displays or find the explanations on the page.
Will participants find the course design analytics feature useful?
We felt it was critical to get measures on this since it directly touches upon Argos’ value proposition.
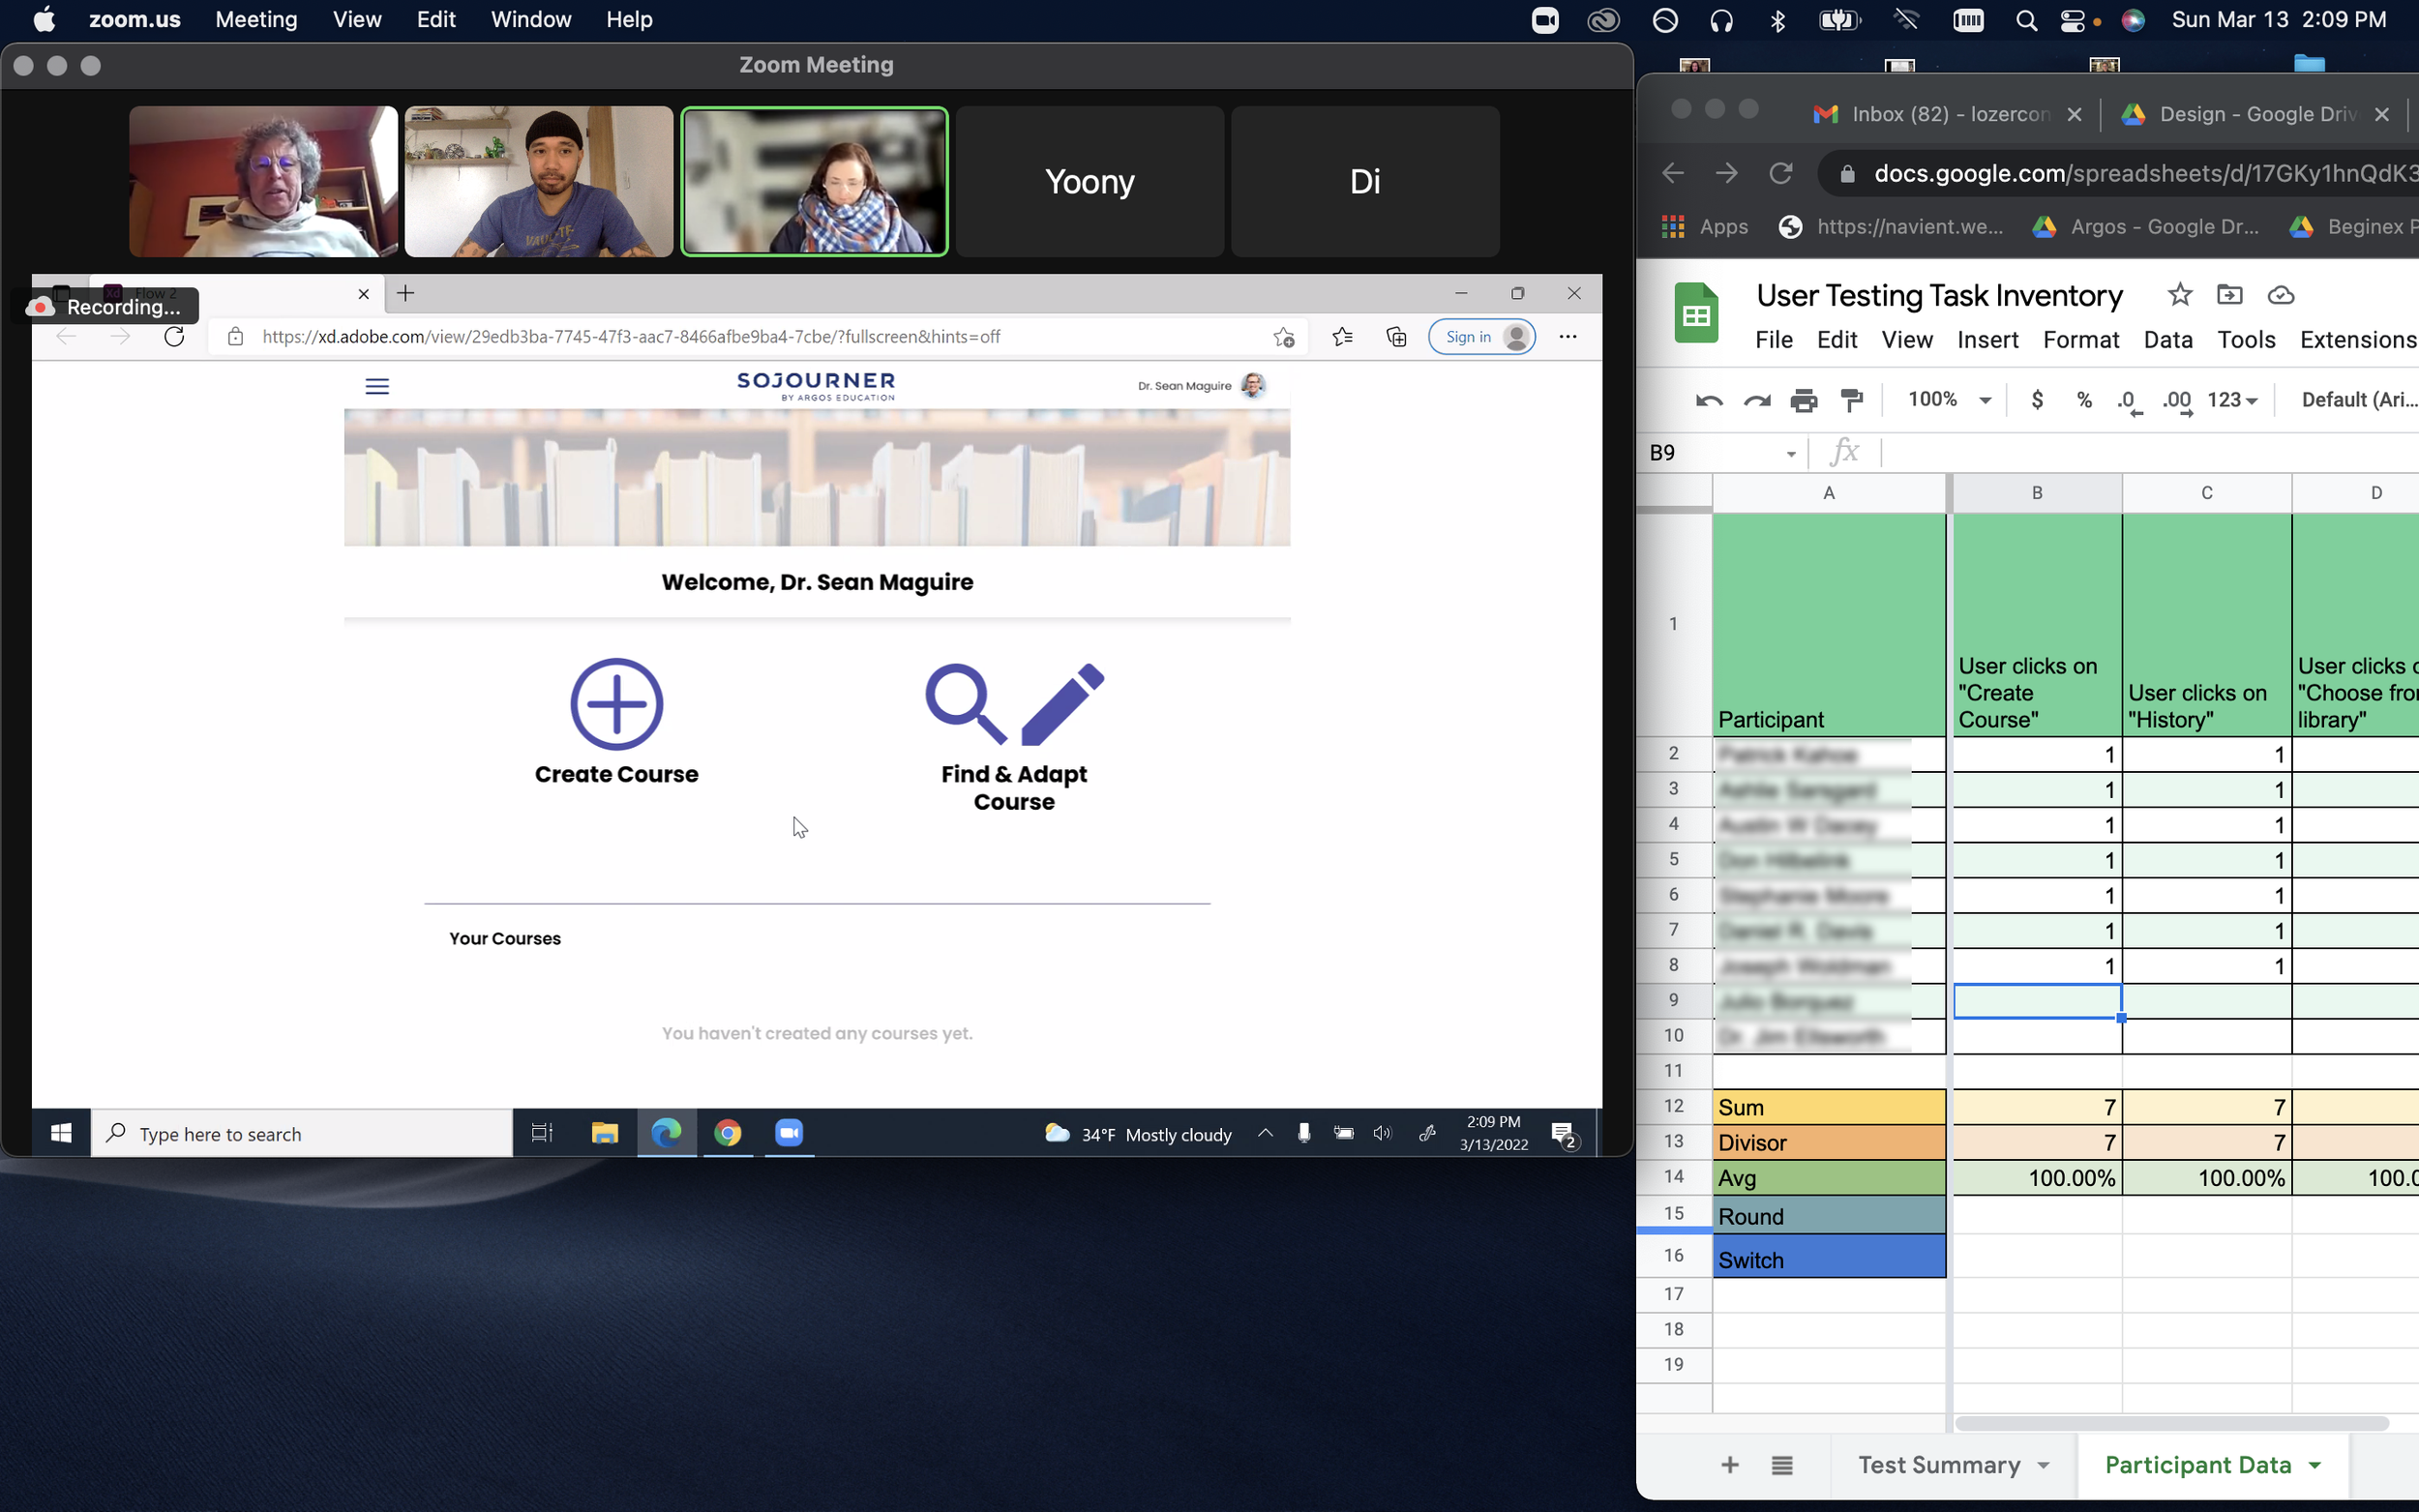
9 participants shared their screens on Zoom as they went through the prototype and completed tasks while we prompted them to think aloud.
They also answered 4 attitudinal questions to help get a measure on what they thought about the analytics feature.
Results: Areas of Success ***(REPLACE IMGS W/ Higher res)

Overall Usability
Feels Clean
Easy to use
Highly intuitive
Course Set-up
Structure is easy to understand
Sidebar is useful
Appreciate collapsible feature
Design Analytics
Valuable tool
Learning opportunity
10,000-mile view
Loved quick edits ability
"How innovative do you find this feature?" (learning analytics)
Very Innovative (avg 4.79/5)
"How relevant is this product to you?"
Very relevant (avg 4.5/5)
"How likely are you to recommend this product to others in your field?"
Likely (avg 3.8/5)
"How likely are you to consider switching to this product?"
Likely (avg 4/5)
Results: Opportunities for Improvement ***(REPLACE IMGS W/ Higher res)
Users had a hard time reading the small font used on various dashboards, buttons, and the course structure sidebar.
Font size now has a minimum size of at least 16 pt across the whole product. Hover states that show component details are employed to provide more space on the table which increases readability.
"Awfully small so having a hard time
reading it."
-Faculty

Less tech-savvy users lacked confidence in which items were clickable, draggable, or could be scrolled.
Actionable items were redesigned to have obvious affordances to communicate what they could do. E.G: Clickable text was replaced with buttons.
“What happened there?
How do I know what I just did?”
-Faculty
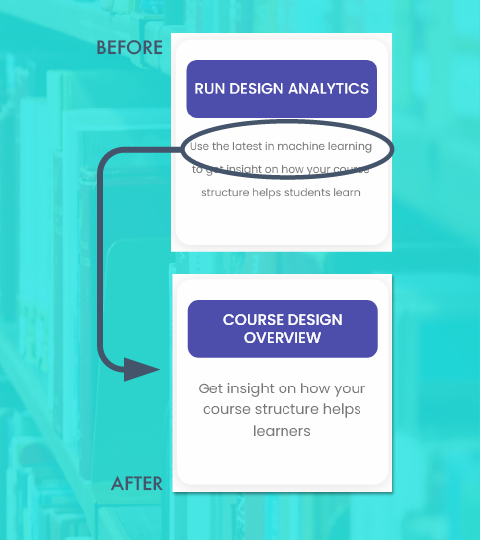
Faculty-type users reacted negatively to the terms “Design Analytics” and “Machine Learning.”
The feature name was changed to “Course Design Overview” and language that emphasized technology was replaced with language that emphasized improving learner outcomes.
“I could feel this controlling me.”
-Faculty
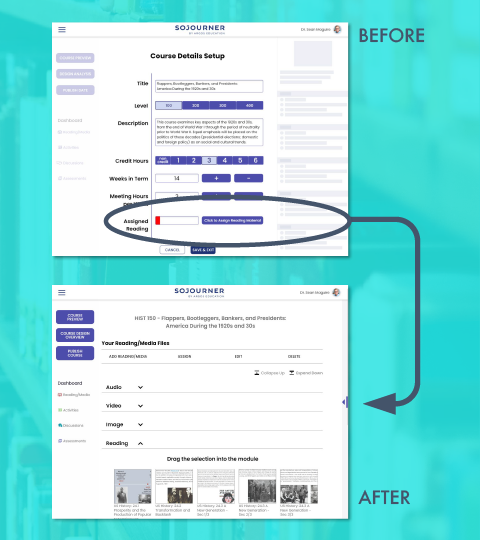
Most users were confused by the placement of the “Assign Reading” portion of the module.
Several users felt a negative reaction to the red color in the progress bar.
We created a separate “Add Reading/Media” flow as part of the main course building and removed the progress bar.
“Je**s Ch**t! It’s red!”
-Faculty
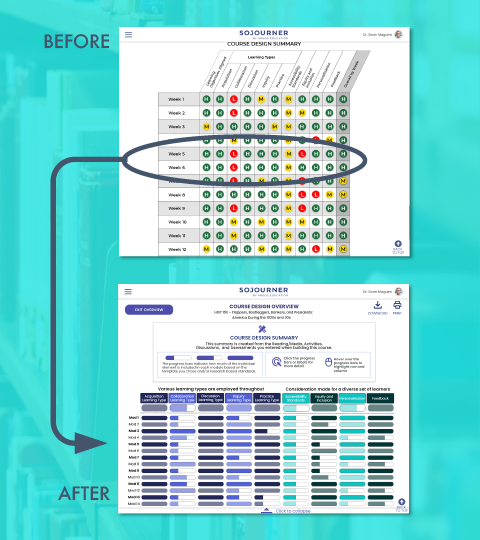
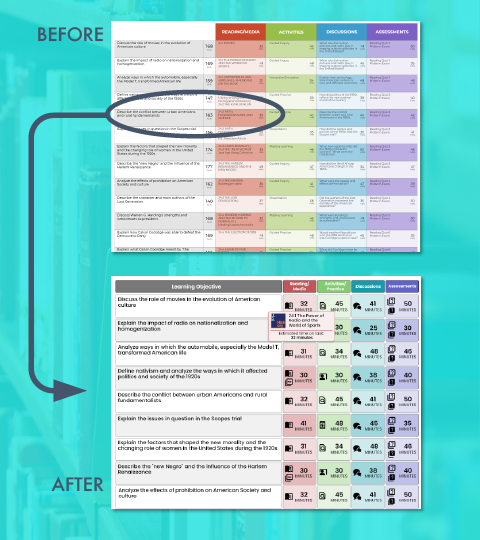
Users found the summary table overwhelming and were unclear on the meaning of “high/medium/low” on data displays.
Progress bars replaced the letters for levels and an emotionally neutral color palette replaced the “stop light” colors. Info is first presented at a summary level with the option to deep dive into the granular data just a click away.
“Okay, so my first impression of this is that it’s overwhelming… It’s a lot to take in… It’s extremely colorful.”
-Instructional Designer

Faculty-type users weren’t sure of how the data in the various displays were derived which led to distrust of the data.
All data displays now have an explanation of the data’s origin.
“It’s going to bug me- Where did it come from?
It’s awfully precise…
This gives me a sense of false precision.”
-Faculty
Final Prototype ***(replace gifs w/ vid clips)
“Help instructors be their best selves through learning science data”
We kept this in mind when moving forward with the reimagining of Sojourner. Learning science is baked into the product meaning that the very act of creation is a realization of user interface enabling course creators to do better than they might’ve imagined.
Course Creation: One screen sets you up for success
Just one setup screen sets up the course and its entire structure. Access this part of the prototype here.
Course Structure: A million moving parts all in one place
A populate-as-you-go outline of the course allows course creators to see what's been planned at any given time in the course. Using data from the course creation screen, the overall structure of the course is built out for immediate slotting of content.
Access this part of the prototype here.
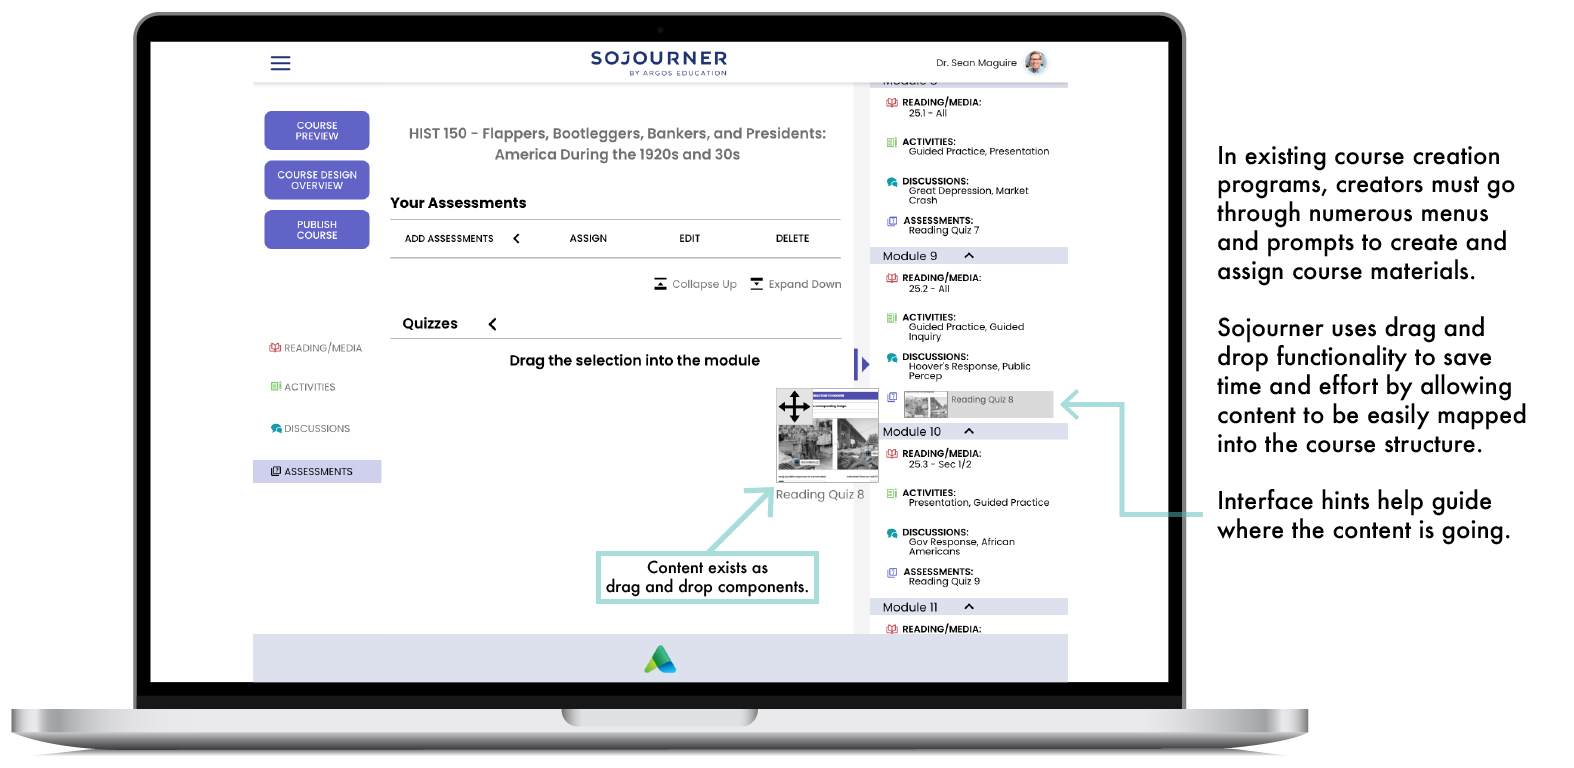
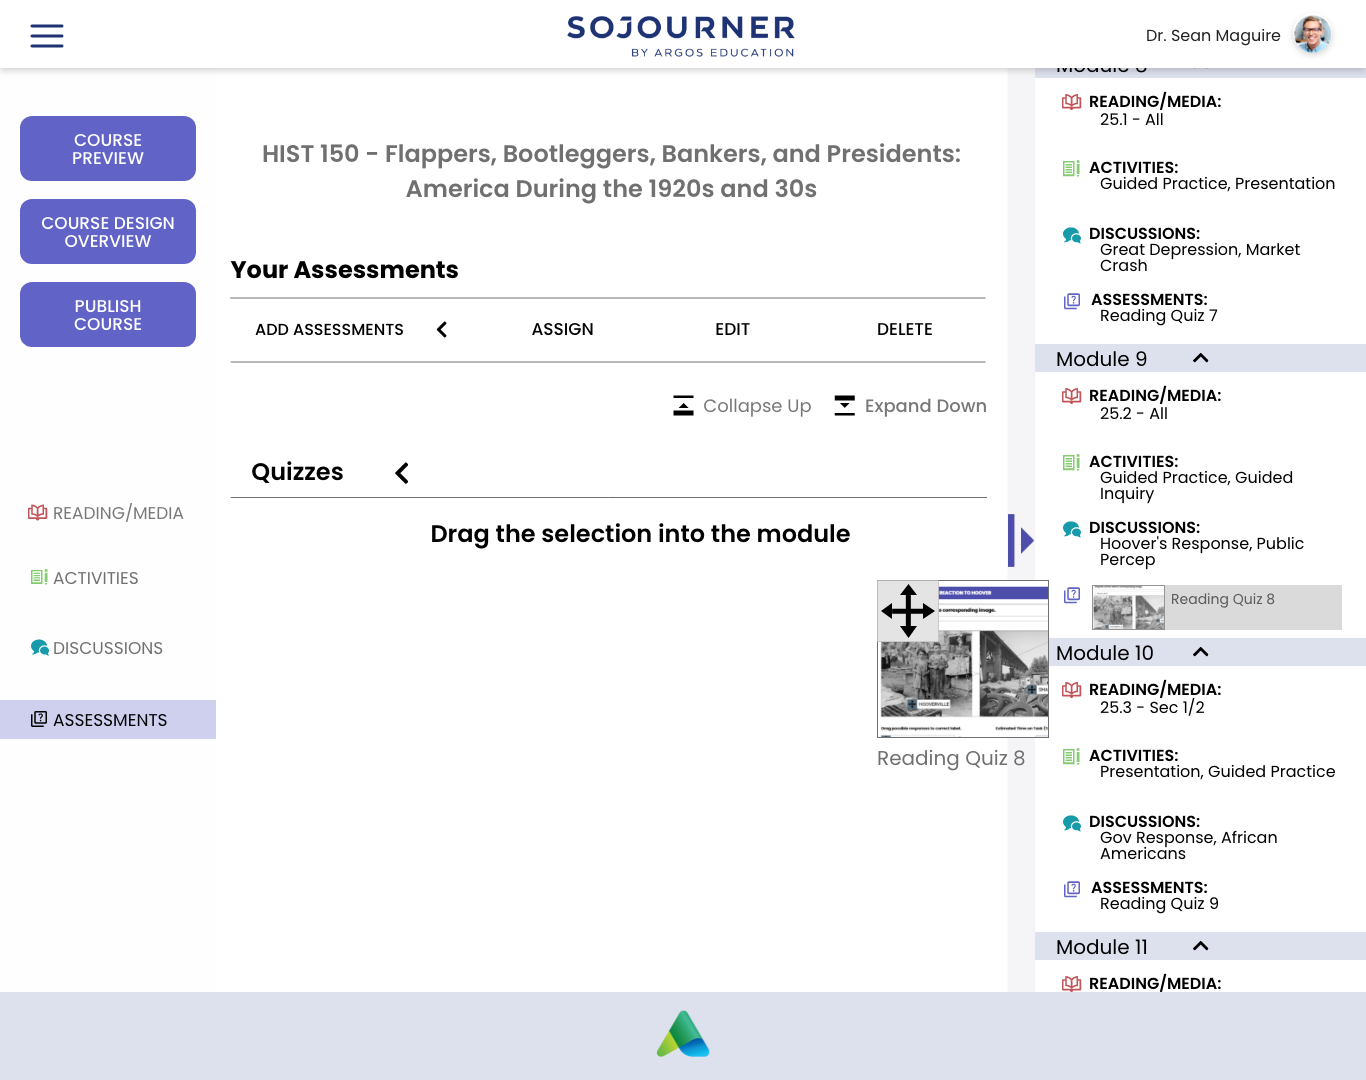
Drag & Drop Content: Set it and forget it
All content can be planned and assigned using a drag and drop interface at many levels in the interface. The UI gives feedback about where your content will land as well as a confirmation message that assignment was successful so that less tech savvy users understand what they're doing and have accomplished.
Access this part of the prototype here.
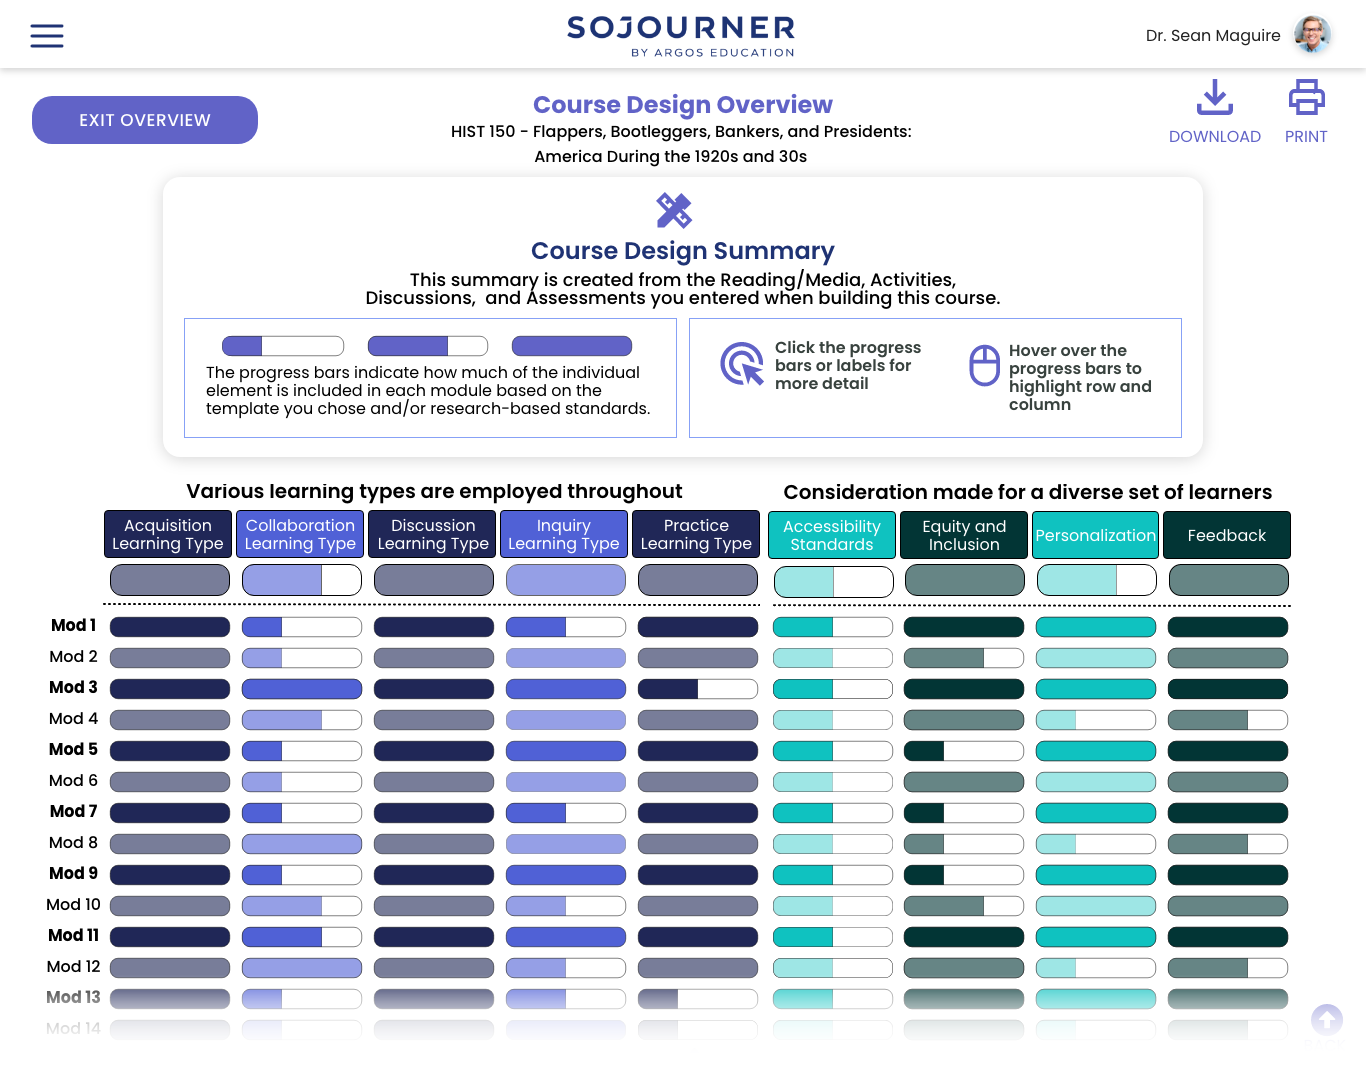
Design Analytics: Insight on how to Level Up Your Course
Course creators can leverage the power of Sojourner to analyze and give insights into what the student experience might be like through summary dashboards that give a high-level view of how the course content aligns with learning science considerations.
Summaries can be expanded to provide a module-by-module view for those wanting more granular information.
Access this part of the prototype here.
Course creators can also receive insights concerning how the course composition breaks down regarding task type, grade weighting, and learning type as well as how course content measures against standards of accessibility, equity & inclusion, personalization, and feedback. All of those listed areas are important to learning science practices and helping course creators realize if the course matches their vision.
Much like the general course structure, the learning objectives table gives a summary of the structure of learning goals and how they are supported. Hover state pop-ups help keep the table readable while giving more specific information.
Each objective can be clicked on to give more information while also enabling the course creator to directly access the related content if they want to make changes.
The entire happy path final prototype can be accessed here.
Client/Impact
Since the client asked us to completely reimagine the course creation experience, we didn't have baseline KPIs to quantify how successful we were. However, the client feedback after the case study presentation and final demo were as follows:
“Was it a success? Overwhelmingly so. Every week we were excited to see what you’d come to us with.”
"You’ve definitely expanded our thinking about something we’ve been struggling with."
"You have definitely taught us something new"
"In all seriousness, if we had more funding, we’d be offering you on-staff positions"

Next Steps
The 10-week challenge my team and I tackled represents a small piece of Argos’ vision of a creator economy platform for course creators. Further cycles in the UX process would focus on fine-tuning the new course creation flow while considering how this flow interlocks with other flows that form the ecosystem of the platform.
Research Actions:
more empathy interviews and usability testing sessions with “pure” faculty-type users
to learn how to position and talk about learning science as a means to drive greater adoption
interview a wider variety of subject matter course creators
to see how subject matter may or may not affect the course creation process
test the different flows of the most up-to-date prototype with more complex tasks and measure SUS
to establish benchmarks to better track usability over iteration cycles
Design Actions:
create the “find & adopt” path of course creation
a few faculty members said they would want to “get the lay of the land” or normally work off an existing course
define what the OER selection and other content selection experiences could be
use of OER is critical to Argos’ plan to supply content while minimizing student costs
tweak or alter the course creation experience to connect with other planned user task flows
to start supporting longer user journeys and move closer towards fully realizing the monetization model
Lessons Learned
PUT YOUR CLIENT ON SPEED DIAL
The weekly touch bases with the client proved essential in keeping the project in line with their business objectives while also helping to close the iteration loop faster -thereby accelerating the development process.
BEING STRATEGIC ABOUT USER RESEARCH IS A MUST
The time with users is never enough so it was vital to understand how our user research would help address the business goals of the product. This was especially important to consider since the team had to do so much generative research to build out product criteria for an experience that didn’t exist.
CLIENTS HAVE ASSUMPTIONS EVEN IF THEY ASSUME THEY DON’T
When the team kicked off the project, the client briefed us with their understanding of who course creators are and what they do. While a lot of what they communicated to us seemed to be validated in our research, there were some important aspects that were invalidated in the same body of work. The takeaway is: Trust, but verify.